






在 nginx 中配置流量监控看板,核心做法是启用 nginx-module-vts(nginx virtual host traffic status)模块。该模块通过暴露一个 json 格式的 api 接口,供 prometheus 抓取指标或 grafana 直接渲染,从而实现可视化的流量监控。

Nginx 如何编译并开启 vhost_traffic_status 模块?
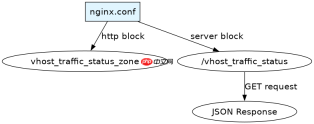
要使用此功能,必须重新编译 Nginx 以包含 --with-http_v2_module 和 --add-module=.../nginx-module-vts。配置时需在 http 块中定义状态区域,并在 server 块中指定状态输出位置。
events {
    worker_connections 1024;
}

http {
    # 1. 定义 VTS 状态存储区域
    vhost_traffic_status_zone shared=vhost:10m;

    server {
        listen 80;
        server_name localhost;

        # 2. 开启特定 location 的监控数据输出
        location /vhost_traffic_status {
            vhost_traffic_status_display;
            vhost_traffic_status_display_format json; # 可选:json, html, csv
        }

        location / {
            root /usr/share/nginx/html;
            index index.html;
        }
    }
}
上述配置中,vhost_traffic_status_zone 定义了共享内存区域用于统计,vhost_traffic_status_display 指令启用了状态页面的访问权限。访问 /vhost_traffic_status 将返回当前所有虚拟主机的流量统计 JSON 数据。
Prometheus 与 Grafana 如何对接获取实时数据?
Prometheus 通过 scrape_configs 定期拉取 Nginx 暴露的 JSON 接口,Grafana 则连接 Prometheus 作为数据源进行图表展示。需要确保 Prometheus 服务器能网络连通 Nginx 的状态端口。


# prometheus.yml 示例配置
scrape_configs:
  - job_name: 'nginx'
    metrics_path: '/vhost_traffic_status'
    scheme: http
    static_configs:
      - targets: ['nginx-server-ip:80']
    # 注意:VTS 默认输出 JSON,需配合 nginx-vts-exporter 转换为 Prometheus 格式
    # 或者直接使用 nginx-vts-exporter 代理 Nginx 并暴露标准 metrics
通常建议部署 nginx-vts-exporter 中间件。它读取 Nginx 的 JSON 数据,并将其转换为 Prometheus 标准的 Metrics 格式(如 nginx_vhost_requests_total)。Prometheus 抓取 exporter 的地址,Grafana 导入社区提供的 Dashboard ID(如 16956)即可看到完整的流量看板,包括请求数、带宽、状态码分布等。
VTS 模块统计的总流量单位是什么?
VTS 模块统计的流量(bytes)单位是字节(Byte),而非位(bit)。在 Grafana 面板中展示时,通常需要乘以 8 转换为 bit,或使用单位换算函数将其显示为 KB/MB/GB。例如,nginx_vhost_bytes_total 字段表示累计传输的字节数。


