
Home >Software Tutorial >Office Software >How to create smart charts in Excel
How to create smart charts in Excel

- 王林forward
- 2024-04-17 13:46:081188browse
Take the statistical table below as an example:
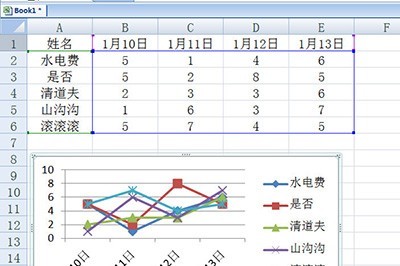
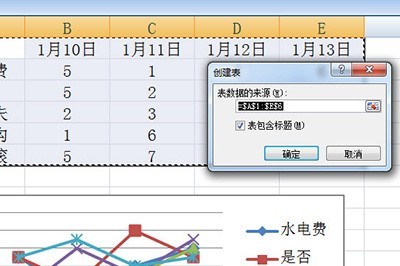
In such a table, if a data is inserted, the chart will not be updated. The next thing to do is to select all tables, hold down CTLR L to create the table, and click OK in the pop-up window. In this way, the smart chart is generated.
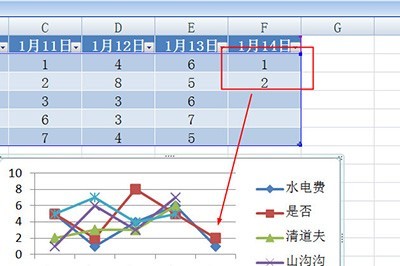
Insert numbers into the table and the chart below will automatically update.
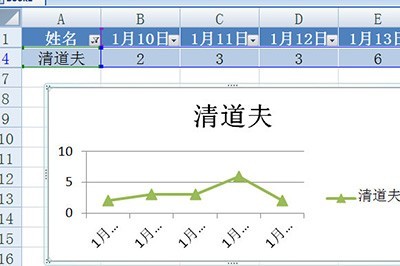
Finally, there is a little trick. There are too many line segments in the chart. If you want to see a certain person’s chart alone, you can click the small arrow in the name column and select the specified person. Below The chart will also update automatically.
The above is the detailed content of How to create smart charts in Excel. For more information, please follow other related articles on the PHP Chinese website!