


The detailed operation method of inserting a chart with horizontal and vertical coordinates into an Excel table will be introduced to you in detail by PHP editor Banana. Inserting charts with horizontal and vertical coordinates in Excel can communicate data to others more clearly and improve the efficiency of data analysis. Through simple steps, you can easily insert various charts into Excel tables and optimize the data display effect. Next, let’s learn about the specific steps!
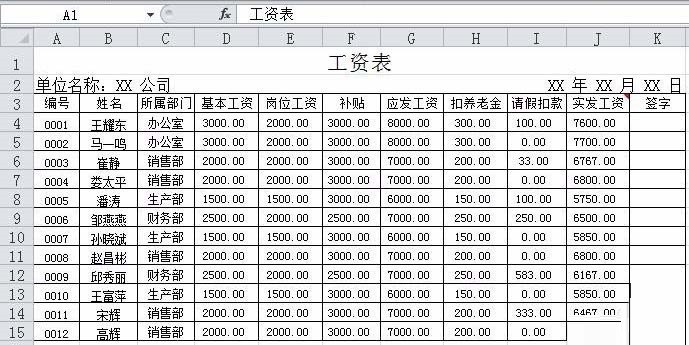
1. There is now a salary form as an example. Figure 1 is the existing salary table, Figure 2 is the target operation. Here, use the data in the B3:B15 and J3:J15 areas to create a chart, that is, the employee's name and the employee's total salary. These two sets of data are put into the chart.
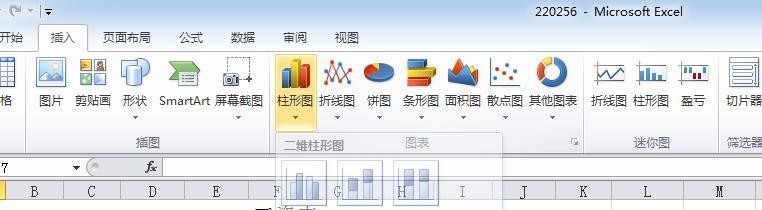
2. Click a blank cell. Click Insert - Chart. What is required here is a two-dimensional clustered column chart. Please read the question requirements carefully. As soon as we press the two-dimensional clustered column chart, the chart will come out, but we will find that the chart is blank because we need to select the data ourselves.
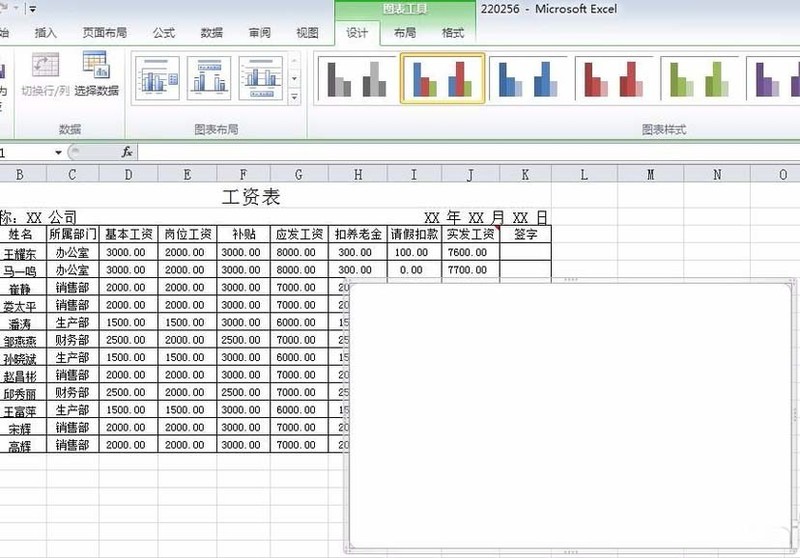
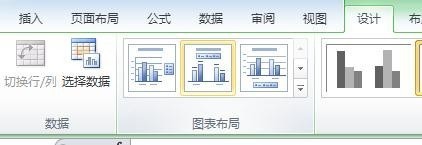
3. When the blank form comes out, we will find that the function bar also changes accordingly. It is a super easy-to-use software ~ Figure 2 is what we will use: Data-Select data. Look, we have to enter the data.
4. A dialog box will appear. Under normal circumstances, the legend items (series) are all ordinates. Then we first extract the data of the ordinate, click on the blank space of the chart data area, and get J3:J15, which is the salary, as shown in the figure below. Then extract the data of the abscissa, click Edit in the dialog box, and get B3:B15, which is the name. Be careful not to put the name in it. To correspond one to one.
5. We will find that the previous chart was not completed successfully. The abscissa has no title, the chart has no title, and the position of the legend seems to be able to be changed. At this time, change the functional area to Layout. There are many new things. In the Layout-tab, you can find the things we want to change: chart title, axis title, legend.
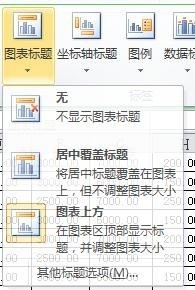
6. Click the chart title and you will find three options to choose from. Here we choose the third one: Above the chart. This means that the chart title we want will appear above the chart later and can be modified.
7. Click the axis title and you will find that there are two options, and we only need to change the abscissa. Select the first one here, the main abscissa axis. For the title and sorting, we select it below the coordinate axis and change the abscissa title as required.
8. Click the legend, and you will find that there are many positions for the legend to choose from. Here, choose to display it at the bottom.
The above is the detailed content of Detailed operation method of inserting a chart with horizontal and vertical coordinates into an Excel table. For more information, please follow other related articles on the PHP Chinese website!

Enhance Your Excel Charts: Reducing Gaps Between Bars and Columns Presenting data visually in charts significantly improves spreadsheet readability. Excel excels at chart creation, but its extensive menus can obscure simple yet powerful features, suc

Excel web version features enhancements to improve efficiency! While Excel desktop version is more powerful, the web version has also been significantly improved over the past year. This article will focus on five key improvements: Easily insert rows and columns: In Excel web, just hover over the row or column header and click the " " sign that appears to insert a new row or column. There is no need to use the confusing right-click menu "insert" function anymore. This method is faster, and newly inserted rows or columns inherit the format of adjacent cells. Export as CSV files: Excel now supports exporting worksheets as CSV files for easy data transfer and compatibility with other software. Click "File" > "Export"

Excel's LAMBDA Functions: An easy guide to creating custom functions Before Excel introduced the LAMBDA function, creating a custom function requires VBA or macro. Now, with LAMBDA, you can easily implement it using the familiar Excel syntax. This guide will guide you step by step how to use the LAMBDA function. It is recommended that you read the parts of this guide in order, first understand the grammar and simple examples, and then learn practical applications. The LAMBDA function is available for Microsoft 365 (Windows and Mac), Excel 2024 (Windows and Mac), and Excel for the web. E

Quick Links Why Use the Camera Tool?

Master Microsoft Excel with these essential keyboard shortcuts! This cheat sheet provides quick access to the most frequently used commands, saving you valuable time and effort. It covers essential key combinations, Paste Special functions, workboo

Excel's PERCENTOF function: Easily calculate the proportion of data subsets Excel's PERCENTOF function can quickly calculate the proportion of data subsets in the entire data set, avoiding the hassle of creating complex formulas. PERCENTOF function syntax The PERCENTOF function has two parameters: =PERCENTOF(a,b) in: a (required) is a subset of data that forms part of the entire data set; b (required) is the entire dataset. In other words, the PERCENTOF function calculates the percentage of the subset a to the total dataset b. Calculate the proportion of individual values using PERCENTOF The easiest way to use the PERCENTOF function is to calculate the single

In Excel, using the timeline filter can display data by time period more efficiently, which is more convenient than using the filter button. The Timeline is a dynamic filtering option that allows you to quickly display data for a single date, month, quarter, or year. Step 1: Convert data to pivot table First, convert the original Excel data into a pivot table. Select any cell in the data table (formatted or not) and click PivotTable on the Insert tab of the ribbon. Related: How to Create Pivot Tables in Microsoft Excel Don't be intimidated by the pivot table! We will teach you basic skills that you can master in minutes. Related Articles In the dialog box, make sure the entire data range is selected (

Excel's GROUPBY function: Powerful data grouping and aggregation tools Excel's GROUPBY function allows you to group and aggregate data based on specific fields in a data table. It also provides parameters that allow you to sort and filter the data so that you can customize the output to your specific needs. GROUPBY function syntax The GROUPBY function contains eight parameters: =GROUPBY(a,b,c,d,e,f,g,h) Parameters a to c are required: a (row field): A range (one column or multiple columns) containing the value or category to which the data is grouped. b (value): The range of values containing aggregated data (one column or multiple columns).


Hot AI Tools

Undresser.AI Undress
AI-powered app for creating realistic nude photos

AI Clothes Remover
Online AI tool for removing clothes from photos.

Undress AI Tool
Undress images for free

Clothoff.io
AI clothes remover

AI Hentai Generator
Generate AI Hentai for free.

Hot Article

Hot Tools

MinGW - Minimalist GNU for Windows
This project is in the process of being migrated to osdn.net/projects/mingw, you can continue to follow us there. MinGW: A native Windows port of the GNU Compiler Collection (GCC), freely distributable import libraries and header files for building native Windows applications; includes extensions to the MSVC runtime to support C99 functionality. All MinGW software can run on 64-bit Windows platforms.

ZendStudio 13.5.1 Mac
Powerful PHP integrated development environment

VSCode Windows 64-bit Download
A free and powerful IDE editor launched by Microsoft

DVWA
Damn Vulnerable Web App (DVWA) is a PHP/MySQL web application that is very vulnerable. Its main goals are to be an aid for security professionals to test their skills and tools in a legal environment, to help web developers better understand the process of securing web applications, and to help teachers/students teach/learn in a classroom environment Web application security. The goal of DVWA is to practice some of the most common web vulnerabilities through a simple and straightforward interface, with varying degrees of difficulty. Please note that this software

mPDF
mPDF is a PHP library that can generate PDF files from UTF-8 encoded HTML. The original author, Ian Back, wrote mPDF to output PDF files "on the fly" from his website and handle different languages. It is slower than original scripts like HTML2FPDF and produces larger files when using Unicode fonts, but supports CSS styles etc. and has a lot of enhancements. Supports almost all languages, including RTL (Arabic and Hebrew) and CJK (Chinese, Japanese and Korean). Supports nested block-level elements (such as P, DIV),