


php Xiaobian Zimo Catalog PPT is a commonly used document display format that can help the audience better understand the content structure and theme. When making a catalog PPT, you need to consider factors such as clear titles, concise and clear content, neat and beautiful layout, etc. This article will introduce how to create an excellent table of contents PPT to help you improve the display effect and attract the audience's attention.
1. First, click [Smart Graphics] under [Insert] on the toolbar. Some WPS versions display [Smart Graphics], just click it.

#2. After clicking, a dialog box for selecting smart graphics pops up. We see a variety of graphics and flow charts for us to choose from, as shown in the figure below.

#3. If you need a cycle relationship diagram, you can also click the cycle class and select insert from the basic graphics.

#4. After selecting one, click Insert in the lower right corner to quickly insert graphics. As shown in the figure below, a catalog diagram is displayed.

In the process of making ppt, external beauty and inner beauty are not contradictory. External beauty is a powerful supplement to inner beauty! Having outer beauty will attract everyone to discover inner beauty! A jade with an inside but no outside is a jade, and a vase with an outside but no inside is a vase. Only when the inside and outside are cultivated can they complement each other.
Excellent ppt reflects the comprehensive ability behind content refining, logic setting, point of view expression and demonstration expression! Therefore, if the ppt is done well, it is more about your excellent logical performance of the content you want to display. PPT improves a person's influence, not because of your good PPT skills, but because of the persuasiveness brought by the knowledge, skills, ideas or wisdom you share through the auxiliary tool of PPT.
Regarding the method of setting up the PPT directory and the related introduction of PPT production, the editor has finished here. I believe everyone can have a clearer understanding of PPT production. Mastering PPT production skills has many benefits, especially since many companies regard proficiency in PPT production as one of the conditions when recruiting candidates, so I hope everyone can be proficient in it.
The above is the detailed content of How to make directory ppt. For more information, please follow other related articles on the PHP Chinese website!

 Microsoft 365 Will Turn Off ActiveX, Because Hackers Keep Using ItApr 12, 2025 am 06:01 AM
Microsoft 365 is finally phasing out ActiveX, a long-standing security vulnerability in its Office suite. This follows a similar move in Office 2024. Beginning this month, Windows versions of Word, Excel, PowerPoint, and Visio in Microsoft 365 will
 How to Use Excel's AGGREGATE Function to Refine CalculationsApr 12, 2025 am 12:54 AM
Quick Links The AGGREGATE Syntax

 How to Format a Spilled Array in ExcelApr 10, 2025 pm 12:01 PM
Use formula conditional formatting to handle overflow arrays in Excel Direct formatting of overflow arrays in Excel can cause problems, especially when the data shape or size changes. Formula-based conditional formatting rules allow automatic formatting to be adjusted when data parameters change. Adding a dollar sign ($) before a column reference applies a rule to all rows in the data. In Excel, you can apply direct formatting to the values or background of a cell to make the spreadsheet easier to read. However, when an Excel formula returns a set of values (called overflow arrays), applying direct formatting will cause problems if the size or shape of the data changes. Suppose you have this spreadsheet with overflow results from the PIVOTBY formula,
 You Need to Know What the Hash Sign Does in Excel FormulasApr 08, 2025 am 12:55 AM
Excel Overflow Range Operator (#) enables formulas to be automatically adjusted to accommodate changes in overflow range size. This feature is only available for Microsoft 365 Excel for Windows or Mac. Common functions such as UNIQUE, COUNTIF, and SORTBY can be used in conjunction with overflow range operators to generate dynamic sortable lists. The pound sign (#) in the Excel formula is also called the overflow range operator, which instructs the program to consider all results in the overflow range. Therefore, even if the overflow range increases or decreases, the formula containing # will automatically reflect this change. How to list and sort unique values in Microsoft Excel
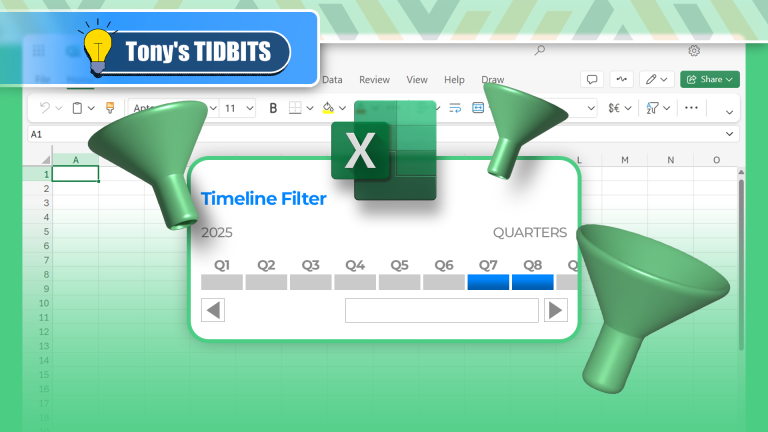 How to Create a Timeline Filter in ExcelApr 03, 2025 am 03:51 AM
In Excel, using the timeline filter can display data by time period more efficiently, which is more convenient than using the filter button. The Timeline is a dynamic filtering option that allows you to quickly display data for a single date, month, quarter, or year. Step 1: Convert data to pivot table First, convert the original Excel data into a pivot table. Select any cell in the data table (formatted or not) and click PivotTable on the Insert tab of the ribbon. Related: How to Create Pivot Tables in Microsoft Excel Don't be intimidated by the pivot table! We will teach you basic skills that you can master in minutes. Related Articles In the dialog box, make sure the entire data range is selected (
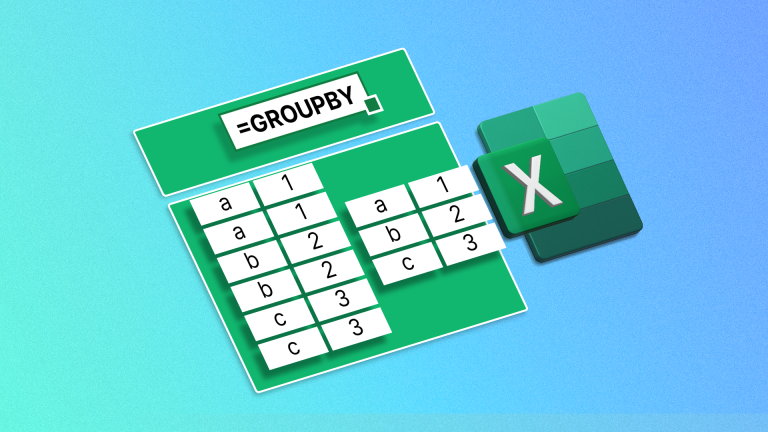 How to Use the GROUPBY Function in ExcelApr 02, 2025 am 03:51 AM
Excel's GROUPBY function: Powerful data grouping and aggregation tools Excel's GROUPBY function allows you to group and aggregate data based on specific fields in a data table. It also provides parameters that allow you to sort and filter the data so that you can customize the output to your specific needs. GROUPBY function syntax The GROUPBY function contains eight parameters: =GROUPBY(a,b,c,d,e,f,g,h) Parameters a to c are required: a (row field): A range (one column or multiple columns) containing the value or category to which the data is grouped. b (value): The range of values containing aggregated data (one column or multiple columns).
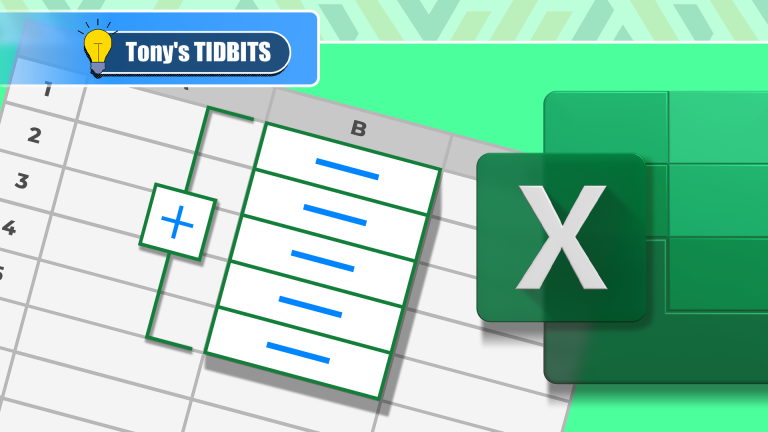 Don't Hide and Unhide Columns in Excel—Use Groups InsteadApr 01, 2025 am 12:38 AM
Excel efficient grouping: say goodbye to hidden columns and embrace flexible data management! While hidden columns can temporarily remove unnecessary data, grouping columns are often a better choice when dealing with large data sets or pursuing flexibility. This article will explain in detail the advantages and operation methods of Excel column grouping to help you improve data management efficiency. Why is grouping better than hiding? Hiding columns (right-click on the column title and select "Hide") can easily lead to data forgetting, even the column title prompt is not reliable because the title itself can be deleted. In contrast, grouped columns are faster and more convenient to expand and fold, which not only improves work efficiency, but also enhances user experience, especially when multi-person collaboration. Additionally, grouping columns allow creation of subgroups, which cannot be achieved by hidden columns. This is the number


Hot AI Tools

Undresser.AI Undress
AI-powered app for creating realistic nude photos

AI Clothes Remover
Online AI tool for removing clothes from photos.

Undress AI Tool
Undress images for free

Clothoff.io
AI clothes remover

AI Hentai Generator
Generate AI Hentai for free.

Hot Article
Hot Tools

ZendStudio 13.5.1 Mac
Powerful PHP integrated development environment

SublimeText3 Linux new version
SublimeText3 Linux latest version

VSCode Windows 64-bit Download
A free and powerful IDE editor launched by Microsoft

SublimeText3 Mac version
God-level code editing software (SublimeText3)

Dreamweaver CS6
Visual web development tools

