ホームページ >ウェブフロントエンド >Vue.js >vue3.x を使用してフローチャートを描画する手順を段階的に説明します。
vue3.x を使用してフローチャートを描画する手順を段階的に説明します。
- 青灯夜游転載
- 2022-06-08 11:57:449131ブラウズ
vue3.x を使用してフローチャートを描画するにはどうすればよいですか?以下の記事ではvue3.xをベースにしたフローチャートの描画方法を紹介していますので、ご参考になれば幸いです。

GitHub ワークフロー
https://github.com/554246839/component - test/tree/dev/src/components/workflow主にワークフローシナリオのフローチャートの描画と実装方法について説明します。 (学習ビデオ共有:
vuejs ビデオ チュートリアル )
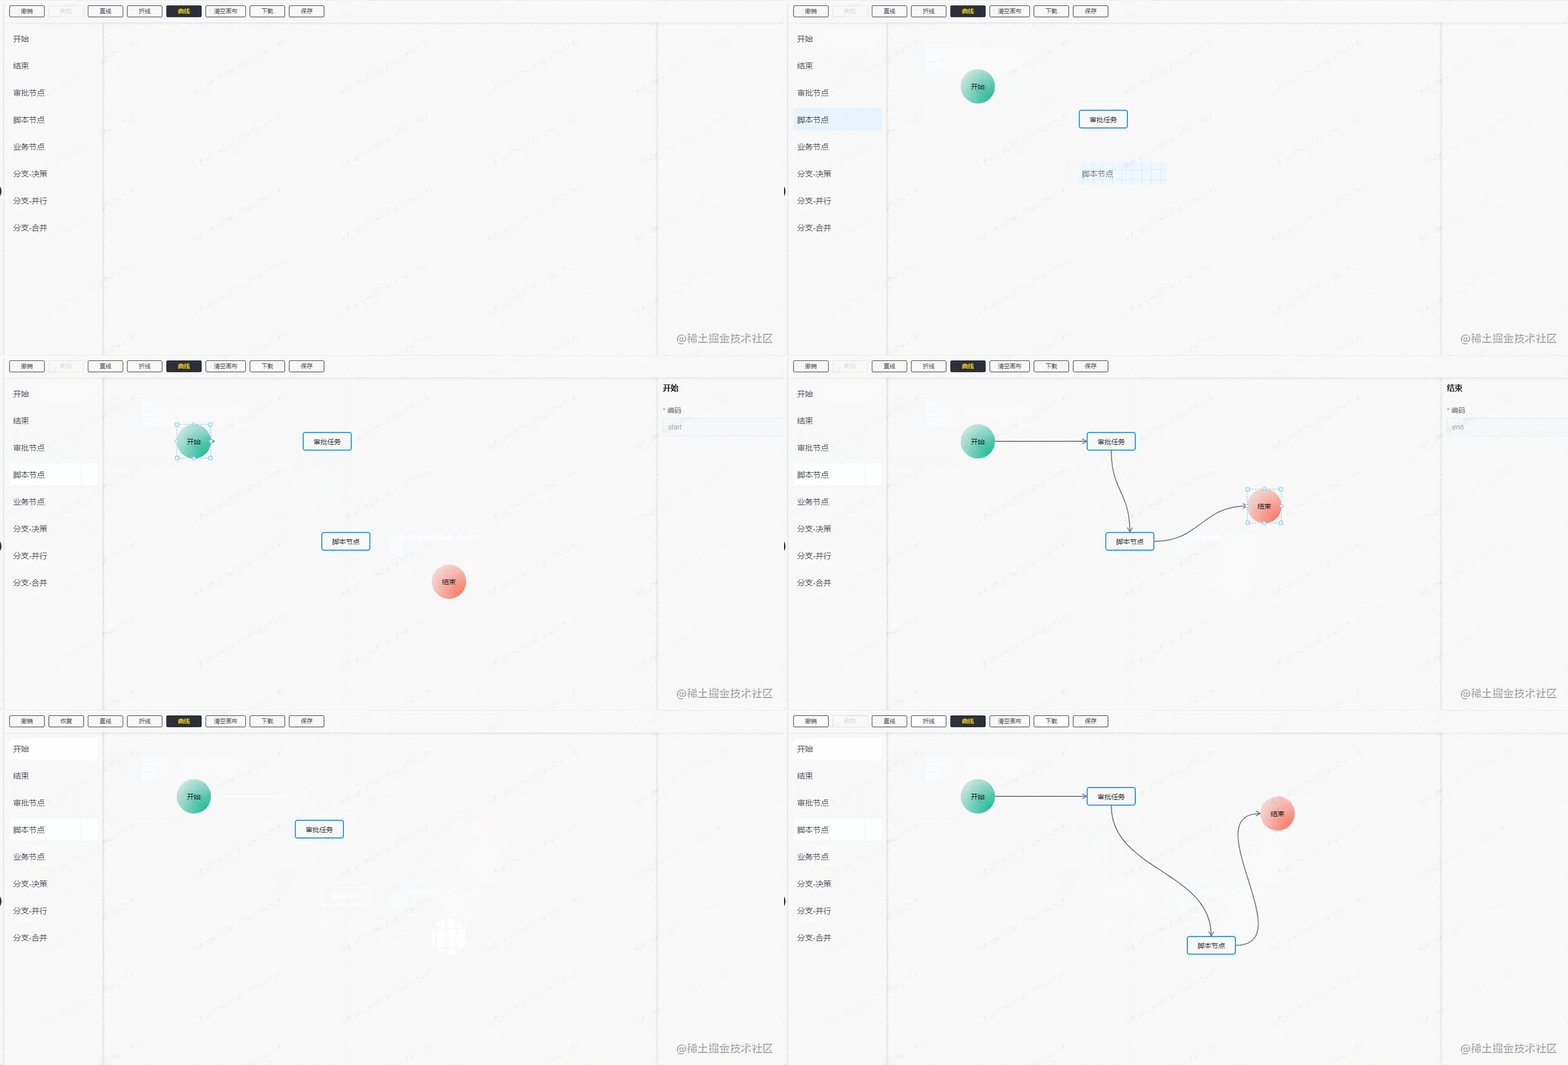
以下はレンダリングです: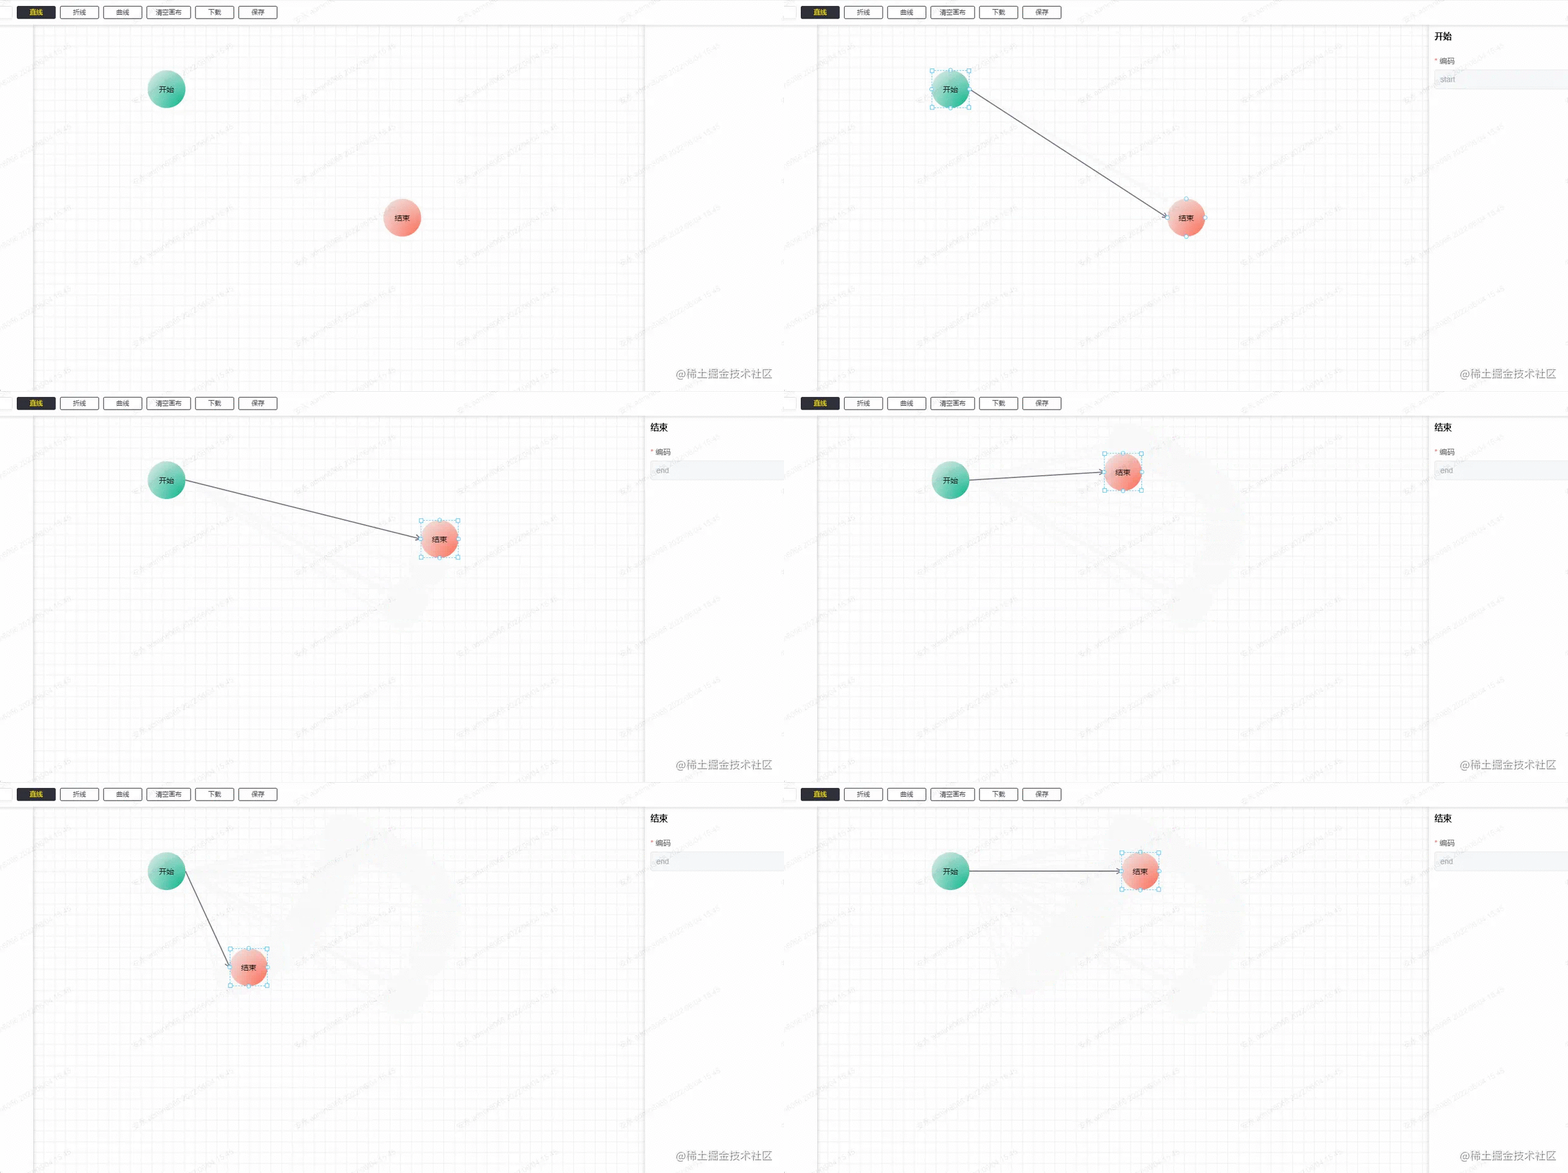

- ノードと接続線の設定可能な構成
- ノードとノードのドラッグ アンド ドロップとレンダリング接続線の描画
- ノードと接続線の選択
- ##ノードのスタイル調整 ##ノード移動時の吸着
- ##元に戻す・戻す
- 設定可能なノードと接続線
ノード構成情報
[
  {
    'id': '', // 每次渲染会生成一个新的id
    'name': 'start', // 节点名称,也就是类型
    'label': '开始', // 左侧列表节点的名称
    'displayName': '开始', // 渲染节点的显示名称(可修改)
    'className': 'icon-circle start', // 节点在渲染时候的class,可用于自定义节点的样式
    'attr': { // 节点的属性
      'x': 0, // 节点相对于画布的 x 位置
      'y': 0, // 节点相对于画布的 y 位置
      'w': 70, // 节点的初始宽度
      'h': 70  // 节点的初始高度
    },
    'next': [], // 节点出度的线
    'props': [] // 节点可配置的业务属性
  },
  // ...
]- 接続線構成情報
// next
[
  {
    // 连接线的id
    'id': 'ee1c5fa3-f822-40f1-98a1-f76db6a2362b',
    // 连接线的结束节点id
    'targetComponentId': 'fa7fbbfa-fc43-4ac8-8911-451d0098d0cb',
    // 连接线在起始节点的方向
    'directionStart': 'right',
    // 连接线在结束节点的方向
    'directionEnd': 'left',
    // 线的类型(直线、折线、曲线)
    'lineType': 'straight',
    // 显示在连接线中点的标识信息
    'extra': '',
    // 连接线在起始节点的id
    'componentId': 'fde2a040-3795-4443-a57b-af412d06c023'
  },
  // ...
]- ノード属性構成構造
// props
[
  {
    // 表单的字段
    name: 'displayName',
    // 表单的标签
    label: '显示名称',
    // 字段的值
    value: '旅客运输',
    // 编辑的类型
    type: 'input',
    // 属性的必填字段
    required: true,
    // 表单组件的其它属性
    props: {
        placeholder: 'xxx'
    }
  },
  // ...
]- ドロップダウンで選択したデータの場合、ドロップダウン データが多い場合、構成に保存されるデータの量も異なります。非常に大きいので、すべてのドロップダウンデータを一元管理できます。左側の構成ノードの情報を取得する場合は、すべてのドロップダウンデータを抽出し、props の name 値をキーにして保存します。これを使用して、props.name を使用して、対応するドロップダウン データを取得します。
- さらに、接続線のプロパティを設定する必要があります。ノードのプロパティと比較すると、各ノードのプロパティは異なる場合がありますが、ノードが存在しない場合、接続線は存在しません。接続線のプロパティは、接続線の生成時に接続線のプロパティに追加されます。もちろん、接続線のプロパティを同じに設定することも、異なるノードに応じて異なる接続線のプロパティを設定することもできます。
最後に使用した方法:
<template>
<workflow
ref="workflowRef"
@component-change="getActiveComponent"
@line-change="getActiveLine"
main-height="calc(100vh - 160px)">
</workflow>
</template>
<script setup>
import { ref } from 'vue'
import Workflow from '@/components/workflow'
import { commonRequest } from '@/utils/common'
import { ElMessage, ElMessageBox } from 'element-plus'
import { useRoute } from 'vue-router'
const route = useRoute()
const processId = route.query.processId // || 'testca08c433c34046e4bb2a8d3ce3ebc'
const processType = route.query.processType
// 切换的当前节点
const getActiveComponent = (component: Record<string, any>) => {
console.log('active component', component)
}
// 切换的当前连接线
const getActiveLine = (line: Record<string, any>) => {
console.log('active line', line)
}
const workflowRef = ref<InstanceType<typeof Workflow>>()
// 获取配置的节点列表
const getConfig = () => {
commonRequest(`/workflow/getWorkflowConfig?processType=${processType}`).then((res: Record<string, any>) => {
// 需要把所有的属性根据name转换成 key - value 形式
const props: Record<string, any> = {}
transferOptions(res.result.nodes, props)
// 设置左侧配置的节点数据
workflowRef.value?.setConfig(res.result)
getData(props)
})
}
// 获取之前已经配置好的数据
const getData = (props: Record<string, any>) => {
commonRequest(`/workflow/getWfProcess/${processId}`).then((res: Record<string, any>) => {
// 调整属性,这里是为了当配置列表的节点或者属性有更新,从而更新已配置的节点的属性
adjustProps(props, res.result.processJson)
// 设置已配置好的数据,并渲染
workflowRef.value?.setData(res.result.processJson, res.result.type || 'add')
})
}
const init = () => {
if (!processId) {
ElMessageBox.alert('当前没有流程id')
return
}
getConfig()
}
init()
const transferOptions = (nodes: Record<string, any>[], props: Record<string, any>) => {
nodes?.forEach((node: Record<string, any>) => {
props[node.name] = node.props
})
}
const adjustProps = (props: Record<string, any>, nodes: Record<string, any>[]) => {
nodes.forEach((node: Record<string, any>) => {
const oldProp: Record<string, any>[] = node.props
const res = transferKV(oldProp)
node.props = JSON.parse(JSON.stringify(props[node.name]))
node.props.forEach((prop: Record<string, any>) => {
prop.value = res[prop.name]
})
})
}
const transferKV = (props: Record<string, any>[]) => {
const res: Record<string, any> = {}
props.forEach((prop: Record<string, any>) => {
res[prop.name] = prop.value
})
return res
}
</script>ノードをドラッグしてレンダリングし、接続線を描画します
ノードのドラッグについては多くは言いません。ノード はい、ドラッグに関する使用法で、主にレンダリング領域のノードと接続線のデザインです。 ここでのレンダリング領域の考え方は次のとおりです。キャンバス要素をキャンバスの背景として使用し、ノードは div の形式でレンダリングされ、ドラッグされた位置はオブジェクトの相対位置に基づいて移動します。キャンバスの大まかな構造は次のとおりです。
<template>
    <!-- 渲染区域的祖先元素 -->
    <div>
        <!-- canvas 画布,绝对于父级元素定位, inset: 0; -->
        <canvas></canvas>
        <!-- 节点列表渲染的父级元素,绝对于父级元素定位, inset: 0; -->
        <div>
            <!-- 节点1,绝对于父级元素定位 -->
            <div></div>
            <!-- 节点2,绝对于父级元素定位 -->
            <div></div>
            <!-- 节点3,绝对于父级元素定位 -->
            <div></div>
            <!-- 节点4,绝对于父级元素定位 -->
            <div></div>
        </div>
    </div>
</template>
接続線の描画は、次のフィールドの情報に基づいて targetComponentId コンポーネントの位置を見つけて、上の 2 点の間に線を描画します。キャンバス。
リンクには直線、ポリライン、曲線の 3 種類があります。
直線- 直線は最も簡単に描画でき、接続するだけです。 2点です。
// 绘制直线
const drawStraightLine = (
  ctx: CanvasRenderingContext2D,
  points: [number, number][],
  highlight?: boolean
) => {
  ctx.beginPath()
  ctx.moveTo(points[0][0], points[0][1])
  ctx.lineTo(points[1][0], points[1][1])
  // 是否是当前选中的连接线,当前连接线高亮
  shadowLine(ctx, highlight)
  ctx.stroke()
  ctx.restore()
  ctx.closePath()
}
ポリライン
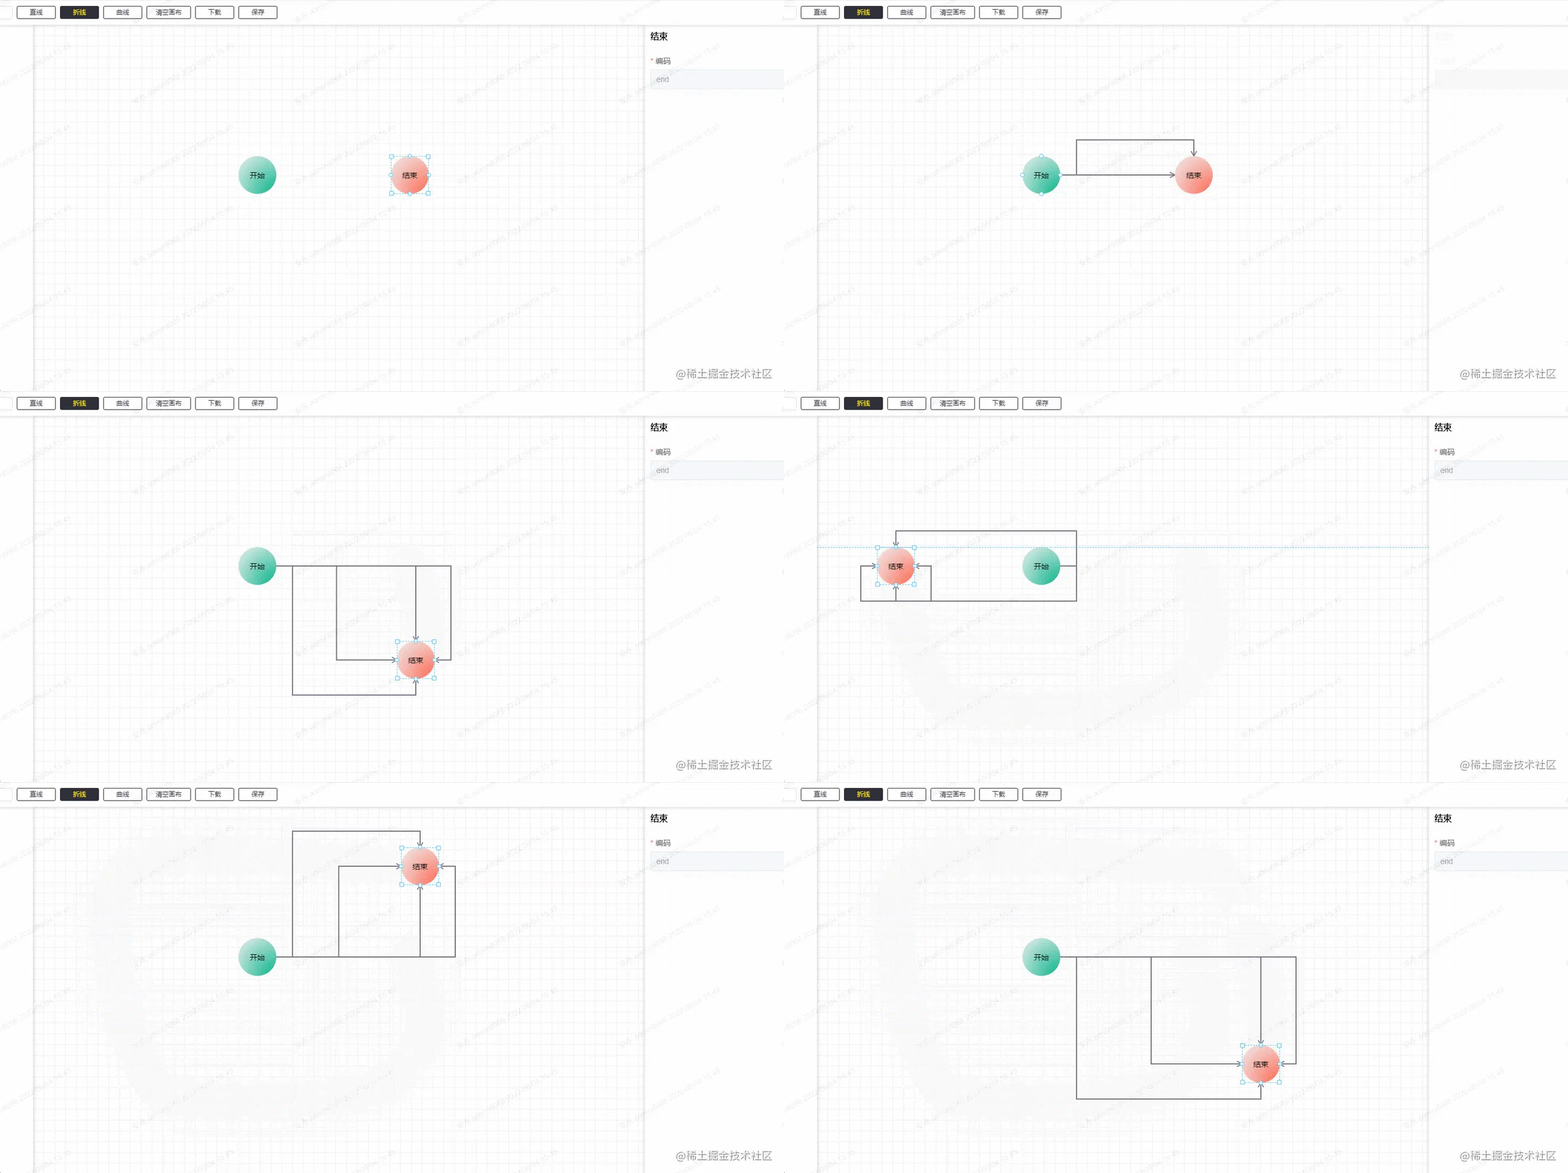
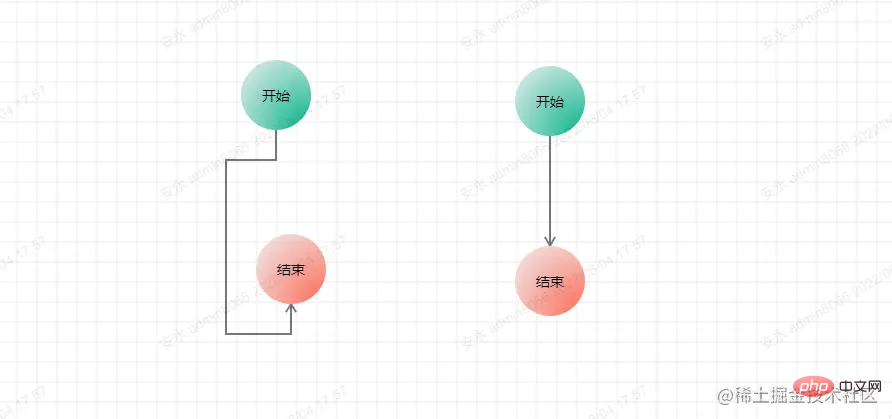
- ポリラインは接続線やノードとの重なりをできるだけ避ける必要があるため、ポリラインの方法はより複雑です。したがって、各接続線のシナリオを決定する必要があり、2 つのノードの幅と高さも考慮して計算する必要があります。次のように:
// 绘制折线
const drawBrokenLine = ({ ctx, points }: WF.DrawLineType, highlight?: boolean) => {
ctx.beginPath()
ctx.moveTo(points[0][0], points[0][1])
for (let i = 1; i < points.length; i++) {
ctx.lineTo(points[i][0], points[i][1])
}
shadowLine(ctx, highlight)
ctx.stroke()
ctx.restore()
ctx.closePath()
} 曲線
曲線
- ポリライン、曲線 アイデアははるかに単純になり、ポリラインの多くのシナリオを考慮する必要はありません。
/**
* Description: 计算三阶贝塞尔曲线的坐标
*/
import WF from '../type'
const coeff = 0.5
export default function calcBezierPoints({ startDire, startx, starty, destDire, destx, desty }: WF.CalcBezierType,
points: [number, number][]) {
const p = Math.max(Math.abs(destx - startx), Math.abs(desty - starty)) * coeff
switch (startDire) {
case 'down':
points.push([startx, starty + p])
break
case 'up':
points.push([startx, starty - p])
break
case 'left':
points.push([startx - p, starty])
break
case 'right':
points.push([startx + p, starty])
break
// no default
}
switch (destDire) {
case 'down':
points.push([destx, desty + p])
break
case 'up':
points.push([destx, desty - p])
break
case 'left':
points.push([destx - p, desty])
break
case 'right':
points.push([destx + p, desty])
break
// no default
}
}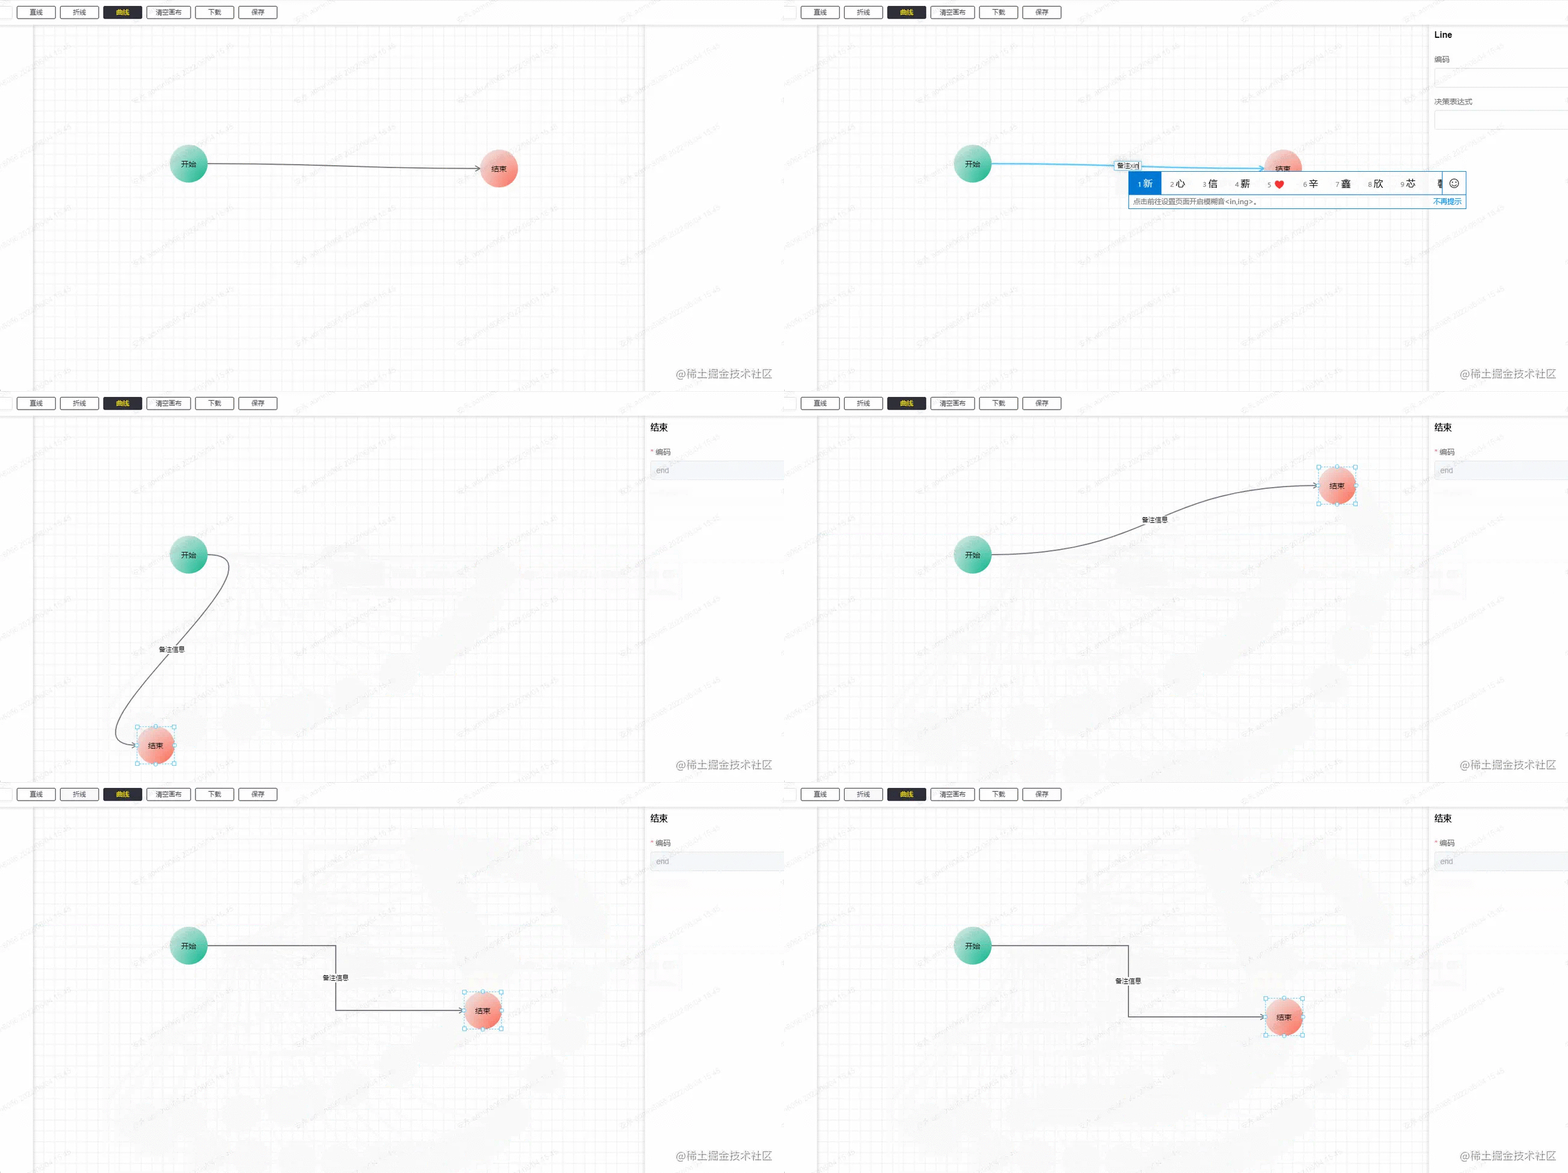 簡単に言うと、最初の制御点は開始点に基づいて計算され、2 番目の制御点は終了点に基づいて計算されます。 。計算方法は、ノードに対する現在の点の方向に基づいて距離を計算し続けることです。この距離は、開始点と終了点の間の最大相対距離の半分に基づいています (少し回りくどいかもしれません。) 。)。
描画方法:
// 绘制贝塞尔曲线
const drawBezier = ({ ctx, points }: WF.DrawLineType, highlight?: boolean) => {
  ctx.beginPath()
  ctx.moveTo(points[0][0], points[0][1])
  ctx.bezierCurveTo(
    points[1][0], points[1][1], points[2][0], points[2][1], points[3][0], points[3][1]
  )
  shadowLine(ctx, highlight)
  ctx.stroke()
  ctx.restore()
  ctx.globalCompositeOperation = 'source-over'    //目标图像上显示源图像
}
节点与连接线的选择
节点是用 div 来渲染的,所以节点的选择可以忽略,然后就是连接点的选择,首先第一点是鼠标在移动的时候都要判断鼠标的当前位置下面是否有连接线,所以这里就有 3 种判断方法,呃... 严格来说是两种,因为折线是多条直线,所以是按直线的判断方法来。
// 判断当前鼠标位置是否有线
export const isAboveLine = (offsetX: number, offsetY: number, points: WF.LineInfo[]) => {
  for (let i = points.length - 1; i >= 0; --i) {
    const innerPonints = points[i].points
    let pre: [number, number], cur: [number, number]
    // 非曲线判断方法
    if (points[i].type !== 'bezier') {
      for (let j = 1; j < innerPonints.length; j++) {
        pre = innerPonints[j - 1]
        cur = innerPonints[j]
        if (getDistance([offsetX, offsetY], pre, cur) < 20) {
          return points[i]
        }
      }
    } else {
      // 先用 x 求出对应的 t,用 t 求相应位置的 y,再比较得出的 y 与 offsetY 之间的差值
      const tsx = getBezierT(innerPonints[0][0], innerPonints[1][0], innerPonints[2][0], innerPonints[3][0], offsetX)
      for (let x = 0; x < 3; x++) {
        if (tsx[x] <= 1 && tsx[x] >= 0) {
          const ny = getThreeBezierPoint(tsx[x], innerPonints[0], innerPonints[1], innerPonints[2], innerPonints[3])
          if (Math.abs(ny[1] - offsetY) < 8) {
            return points[i]
          }
        }
      }
      // 如果上述没有结果,则用 y 求出对应的 t,再用 t 求出对应的 x,与 offsetX 进行匹配
      const tsy = getBezierT(innerPonints[0][1], innerPonints[1][1], innerPonints[2][1], innerPonints[3][1], offsetY)
      for (let y = 0; y < 3; y++) {
        if (tsy[y] <= 1 && tsy[y] >= 0) {
          const nx = getThreeBezierPoint(tsy[y], innerPonints[0], innerPonints[1], innerPonints[2], innerPonints[3])
          if (Math.abs(nx[0] - offsetX) < 8) {
            return points[i]
          }
        }
      }
    }
  }

  return false
}
直线的判断方法是点到线段的距离:
/**
 * 求点到线段的距离
 * @param {number} pt 直线外的点
 * @param {number} p 直线内的点1
 * @param {number} q 直线内的点2
 * @returns {number} 距离
 */
function getDistance(pt: [number, number], p: [number, number], q: [number, number]) {
  const pqx = q[0] - p[0]
  const pqy = q[1] - p[1]
  let dx = pt[0] - p[0]
  let dy = pt[1] - p[1]
  const d = pqx * pqx + pqy * pqy   // qp线段长度的平方
  let t = pqx * dx + pqy * dy     // p pt向量 点积 pq 向量(p相当于A点,q相当于B点,pt相当于P点)
  if (d > 0) {  // 除数不能为0; 如果为零 t应该也为零。下面计算结果仍然成立。
    t /= d      // 此时t 相当于 上述推导中的 r。
  }
  if (t < 0) {  // 当t(r)< 0时,最短距离即为 pt点 和 p点(A点和P点)之间的距离。
    t = 0
  } else if (t > 1) { // 当t(r)> 1时,最短距离即为 pt点 和 q点(B点和P点)之间的距离。
    t = 1
  }

  // t = 0,计算 pt点 和 p点的距离; t = 1, 计算 pt点 和 q点 的距离; 否则计算 pt点 和 投影点 的距离。
  dx = p[0] + t * pqx - pt[0]
  dy = p[1] + t * pqy - pt[1]

  return dx * dx + dy * dy
}
关于曲线的判断方法比较复杂,这里就不多介绍, 想了解的可以去看这篇:如何判断一个坐标点是否在三阶贝塞尔曲线附近
连接线还有一个功能就是双击连接线后可以编辑这条连接线的备注信息。这个备注信息的位置是在当前连接线的中心点位置。所以我们需要求出中心点,这个相对简单。
// 获取一条直线的中点坐标
const getStraightLineCenterPoint = ([[x1, y1], [x2, y2]]: [number, number][]): [number, number] => {
  return [(x1 + x2) / 2, (y1 + y2) / 2]
}

// 获取一条折线的中点坐标
const getBrokenCenterPoint = (points: [number, number][]): [number, number] => {
  const lineDistancehalf = getLineDistance(points) >> 1

  let distanceSum = 0, pre = 0, tp: [number, number][] = [], distance = 0

  for (let i = 1; i < points.length; i++) {
    pre = getTwoPointDistance(points[i - 1], points[i])
    if (distanceSum + pre > lineDistancehalf) {
      tp = [points[i - 1], points[i]]
      distance = lineDistancehalf - distanceSum
      break
    }
    distanceSum += pre
  }

  if (!tp.length) {
    return [0, 0]
  }

  let x = tp[0][0], y = tp[0][1]

  if (tp[0][0] === tp[1][0]) {
    if (tp[0][1] > tp[1][1]) {
      y -= distance
    } else {
      y += distance
    }
  } else {
    if (tp[0][0] > tp[1][0]) {
      x -= distance
    } else {
      x += distance
    }
  }

  return [x, y]
}
曲线的中心点位置,可以直接拿三阶贝塞尔曲线公式求出
// 获取三阶贝塞尔曲线的中点坐标
const getBezierCenterPoint = (points: [number, number][]) => {
  return getThreeBezierPoint(
    0.5, points[0], points[1], points[2], points[3]
  )
}

/**
 * @desc 获取三阶贝塞尔曲线的线上坐标
 * @param {number} t 当前百分比
 * @param {Array} p1 起点坐标
 * @param {Array} p2 终点坐标
 * @param {Array} cp1 控制点1
 * @param {Array} cp2 控制点2
 */
export const getThreeBezierPoint = (
  t: number,
  p1: [number, number],
  cp1: [number, number],
  cp2: [number, number],
  p2: [number, number]
): [number, number] => {
  const [x1, y1] = p1
  const [x2, y2] = p2
  const [cx1, cy1] = cp1
  const [cx2, cy2] = cp2
  const x =
    x1 * (1 - t) * (1 - t) * (1 - t) +
    3 * cx1 * t * (1 - t) * (1 - t) +
    3 * cx2 * t * t * (1 - t) +
    x2 * t * t * t
  const y =
    y1 * (1 - t) * (1 - t) * (1 - t) +
    3 * cy1 * t * (1 - t) * (1 - t) +
    3 * cy2 * t * t * (1 - t) +
    y2 * t * t * t
  return [x | 0, y | 0]
}
在算出每一条的中心点位置后,在目标位置添加备注信息即可:

节点的样式调整
节点的样式调整主要是位置及大小,而这些属性就是节点里面的 attr,在相应的事件下根据鼠标移动的方向及位置,来调整节点的样式。
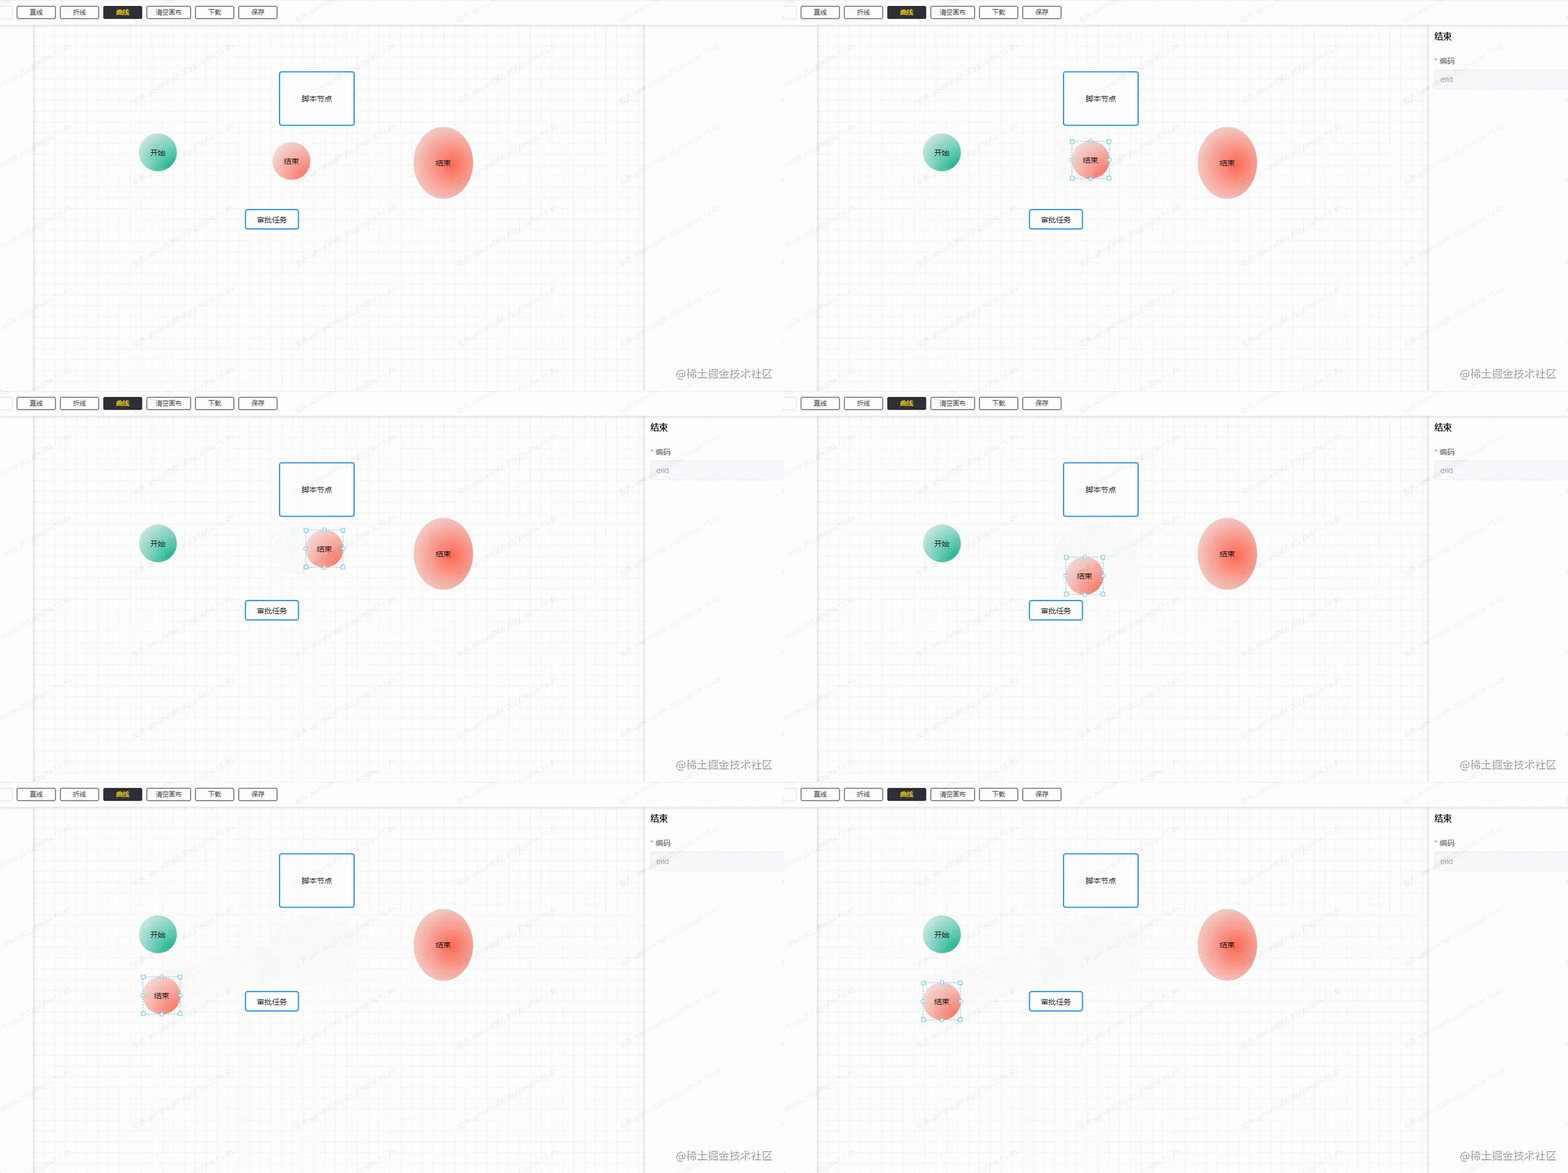
还有批量操作也是同样,不过批量操作是要先计算出哪些节点的范围。
// 获取范围选中内的组件
export const getSelectedComponent = (componentList: WF.ComponentType[], areaPosi: WF.Attr) => {
  let selectedArea: WF.Attr | null = null
  let minx = Infinity, miny = Infinity, maxx = -Infinity, maxy = -Infinity
  const selectedComponents = componentList.filter((component: WF.ComponentType) => {

    const res = areaPosi.x <= component.attr.x &&
      areaPosi.y <= component.attr.y &&
      areaPosi.x + areaPosi.w >= component.attr.x + component.attr.w &&
      areaPosi.y + areaPosi.h >= component.attr.y + component.attr.h

    if (res) {
      minx = Math.min(minx, component.attr.x)
      miny = Math.min(miny, component.attr.y)
      maxx = Math.max(maxx, component.attr.x + component.attr.w)
      maxy = Math.max(maxy, component.attr.y + component.attr.h)
    }
    return res
  })

  if (selectedComponents.length) {
    selectedArea = {
      x: minx,
      y: miny,
      w: maxx - minx,
      h: maxy - miny
    }
    return {
      selectedArea, selectedComponents
    }
  }
  return null
}
这个有个小功能没有做,就是在批量调整大小的时候,节点间的相对距离应该是不动的,这里忽略了。
节点移动时的吸附
这里的吸附功能其实是做了一个简单版的,就是 x 和 y 轴都只有一条校准线,且校准的优先级是从左至右,从上至下。

这里吸附的标准是节点的 6 个点:X 轴的左中右,Y 轴的上中下,当前节点在移动的时候,会用当前节点的 6 个点,一一去与其它节点的 6 个点做比较,在误差正负 2px 的情况,自动更新为0,即自定对齐。
因为移动当前节点时候,其它的节点是不动的,所以这里是做了一步预处理,即在鼠标按下去的时候,把其它的节点的 6 个点都线算出来,用 Set 结构保存,在移动的过程的比较中,计算量会相对较少。
// 计算其它节点的所有点位置
export const clearupPostions = (componentList: WF.ComponentType[], currId: string) => {
  // x 坐标集合
  const coordx = new Set<number>()
  // y 坐标集合
  const coordy = new Set<number>()

  componentList.forEach((component: WF.ComponentType) => {
    if (component.id === currId) {
      return
    }
    const { x, y, w, h } = component.attr
    coordx.add(x)
    coordx.add(x + (w >> 1))
    coordx.add(x + w)
    coordy.add(y)
    coordy.add(y + (h >> 1))
    coordy.add(y + h)
  })

  return [coordx, coordy]
}
判读是否有可吸附的点
// 可吸附范围
const ADSORBRANGE = 2
// 查询是否有可吸附坐标
const hasAdsorbable = (
  coords: Set<number>[], x: number, y: number, w: number, h: number
) => {
  // x, y, w, h, w/2, h/2
  const coord: (number | null)[] = [null, null, null, null, null, null]
  // 查询 x 坐标
  for (let i = 0; i <= ADSORBRANGE; i++) {
    if (coords[0].has(x + i)) {
      coord[0] = i
      break
    }
    if (coords[0].has(x - i)) {
      coord[0] = -i
      break
    }
  }

  // 查询 y 坐标
  for (let i = 0; i <= ADSORBRANGE; i++) {
    if (coords[1].has(y + i)) {
      coord[1] = i
      break
    }
    if (coords[1].has(y - i)) {
      coord[1] = -i
      break
    }
  }

  // 查询 x + w 坐标
  for (let i = 0; i <= ADSORBRANGE; i++) {
    if (coords[0].has(x + w + i)) {
      coord[2] = i
      break
    }
    if (coords[0].has(x + w - i)) {
      coord[2] = -i
      break
    }
  }

  // 查询 y + h 坐标
  for (let i = 0; i <= ADSORBRANGE; i++) {
    if (coords[1].has(y + h + i)) {
      coord[3] = i
      break
    }
    if (coords[1].has(y + h - i)) {
      coord[3] = -i
      break
    }
  }

  // 查询 x + w/2 坐标
  for (let i = 0; i <= ADSORBRANGE; i++) {
    if (coords[0].has(x + (w >> 1) + i)) {
      coord[4] = i
      break
    }
    if (coords[0].has(x + (w >> 1) - i)) {
      coord[4] = -i
      break
    }
  }

  // 查询 y + h/2 坐标
  for (let i = 0; i <= ADSORBRANGE; i++) {
    if (coords[1].has(y + (h >> 1) + i)) {
      coord[5] = i
      break
    }
    if (coords[1].has(y + (h >> 1) - i)) {
      coord[5] = -i
      break
    }
  }

  return coord
}
最后更新状态。
// 获取修正后的 x, y,还有吸附线的状态
export const getAdsordXY = (
  coords: Set<number>[], x: number, y: number, w: number, h: number
) => {
  const vals = hasAdsorbable(
    coords, x, y, w, h
  )

  let linex = null
  let liney = null

  if (vals[0] !== null) { // x
    x += vals[0]
    linex = x
  } else if (vals[2] !== null) { // x + w
    x += vals[2]
    linex = x + w
  } else if (vals[4] !== null) { // x + w/2
    x += vals[4]
    linex = x + (w >> 1)
  }

  if (vals[1] !== null) { // y
    y += vals[1]
    liney = y
  } else if (vals[3] !== null) { // y + h
    y += vals[3]
    liney = y + h
  } else if (vals[5] !== null) { // y + h/2
    y += vals[5]
    liney = y + (h >> 1)
  }

  return {
    x, y, linex, liney
  }
}
撤销和恢复
撤销和恢复的功能是比较简单的,其实就是用栈来保存每一次需要保存的配置结构,就是要考虑哪些操作是可以撤销和恢复的,就是像节点移动,节点的新增和删除,连接线的连接,连接线的备注新增和编辑等等,在相关的操作下面入栈即可。
// 撤销和恢复操作
const cacheComponentList = ref<WF.ComponentType[][]>([])
const currentComponentIndex = ref(-1)
// 撤销
const undo = () => {
  componentRenderList.value = JSON.parse(JSON.stringify(cacheComponentList.value[--currentComponentIndex.value]))
  // 更新视图
  updateCanvas(true)
  cancelSelected()
}
// 恢复
const redo = () => {
  componentRenderList.value = JSON.parse(JSON.stringify(cacheComponentList.value[++currentComponentIndex.value]))
  // 更新视图
  updateCanvas(true)
  cancelSelected()
}
// 缓存入栈
const chacheStack = () => {
  if (cacheComponentList.value.length - 1 > currentComponentIndex.value) {
    cacheComponentList.value.length = currentComponentIndex.value + 1
  }
  cacheComponentList.value.push(JSON.parse(JSON.stringify(componentRenderList.value)))
  currentComponentIndex.value++
}
最后
这里主要的已经差不多都写了,其实最红还有一个挺有用的功能还没有做。就是改变已经绘制的连接线的起止点。
这里的思路是:先选中需要改变起止点的连接线,然后把鼠标移动到起止点的位置,将它从已经绘制的状态改为正在绘制的状态,然后再选择它的开始位置或者结束位置。这个后面看情况吧,有空就加上。
以上がvue3.x を使用してフローチャートを描画する手順を段階的に説明します。の詳細内容です。詳細については、PHP 中国語 Web サイトの他の関連記事を参照してください。

