Maison >interface Web >js tutoriel >Code d'implémentation des graphiques echarts couramment utilisés
Code d'implémentation des graphiques echarts couramment utilisés
- 不言avant
- 2018-09-30 15:41:366051parcourir
Le contenu de cet article concerne le code d'implémentation des graphiques echarts couramment utilisés. Il a une certaine valeur de référence. Les amis dans le besoin peuvent s'y référer.
Le code de cet article est développé sur la base d'ehcarts4.0
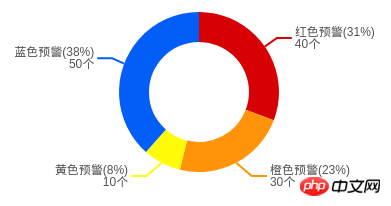
Graphique circulaire

// 饼图配置项
    var option = {
        series: [
            {
                name:'风险预警占比',
                type: 'pie',
                radius: ['25%', '40%'],
                center: ['50%', '50%'],
                roseType: false,
                data: [
                    {
                        value: 40,
                        name: '红色预警'
                    }, {
                        value: 30,
                        name: '橙色预警'
                    }, {
                        value: 10,
                        name: '黄色预警'
                    }, {
                        value: 50,
                        name: '蓝色预警'
                    }
                ],
                label: {
                    fontSize: 12,
                    color:'#545454',
                    formatter: function (param) {
                        return param.name + '(' + Math.round(param.percent) + '%' + ')'
                            + '\n' + param.value +  '个';
                    }
                },
                labelLine: {
                    smooth: false,
                    lineStyle: {
                        width: 2
                    }
                },
                itemStyle: {
                    color:function(params){
                        switch (params.name) {
                            case '红色预警':
                                return '#D70002';
                            case '橙色预警':
                                return '#FF9309';
                            case '黄色预警':
                                return '#FFFB09';
                            case '蓝色预警':
                                return '#035EF7';
                            default:
                                break;
                        }
                    }
                },
            }
        ]
    }
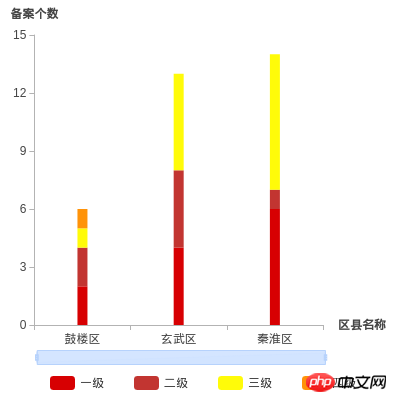
Figure à colonnes empilées

//堆叠柱状图配置项
  var option = {
      backgroundColor: '#fff',
      tooltip: {
          trigger: 'axis',
          axisPointer: {
              type: 'shadow'
          }
      },
      legend: {
          bottom: '10',
          itemGap: 30,
          data: ['一级', '二级', '三级', '四级']
      },
      grid: { //图表的位置
          top: 30,
          left: 10,
          right: 80,
          bottom: 60,
          containLabel: true
      },
      dataZoom: [
          {
              type: 'inside'
          }, {
              type: 'slider',
              start: 0,
              bottom: 40,
              height: '15px',
              fillerColor:'rgba(202,223,255,.8)',
              borderColor:'#b6d2fc',
              handleStyle:{
                  color:'#b6d2fc'
              },
              dataBackground:{
                  lineStyle:{
                      color:'#b6d2fc'
                  },
                  areaStyle:{
                      color:'rgba(202,223,255,.8)'
                  }
              }
          }
      ],
      yAxis: [
          {
              type: 'value',
              name: '备案个数',
              nameTextStyle: {
                  fontSize: 12,
                  fontWeight: 'bold',
                  color: '#454545'
              },
              splitLine: {
                  show: false
              },
              axisLine: {
                  lineStyle: {
                      color: '#B3B3B3'
                  }
              },
              axisLabel: {
                  color: '#454545'
              }
          }
      ],
      xAxis: [
          {
              type: 'category',
              name: '区县名称',
              nameTextStyle: {
                  fontSize: 12,
                  fontWeight: 'bold',
                  color: '#454545'
              },
              axisLine: {
                  lineStyle: {
                      color: '#B3B3B3'
                  }
              },
              axisLabel: {
                  color: '#454545'
              },
              data: ['鼓楼区','玄武区','秦淮区']
          }
      ],
      series: [
          {
              name: '一级',
              type: 'bar',
              stack: '总量',
              barWidth: '10px',
              itemStyle:{
                  color:'#D70002'
              },
              data: [2,4,6]
          },
          {
              name: '二级',
              type: 'bar',
              stack: '总量',
              barWidth: '10px',
              data: [2,4,1]
          },
          {
              name: '三级',
              type: 'bar',
              stack: '总量',
              barWidth: '10px',
              itemStyle:{
                  color:'#FFFB09'
              },
              data: [1,5,7]
          },
          {
              name: '四级',
              type: 'bar',
              stack: '总量',
              barWidth: '10px',
              itemStyle:{
                  color:'#FF9309'
              },
              data: [1]
          }
      ]
    }
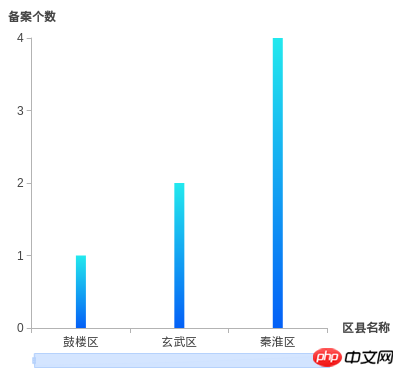
Histogramme de dégradé

//配置项
var option = {
      backgroundColor: '#fff',
      color: [
          new echarts.graphic.LinearGradient(
              0, 0, 0, 1,
              [
                  { offset: 0, color: '#23E9EE' },
                  { offset: 1, color: '#0460F7' }
              ]
          )
      ],
      tooltip: {
          trigger: 'axis',
          axisPointer: {
              type: 'shadow'
          }
      },
      legend: {
          bottom: '10',
          itemGap: 30,
          data: ['一级', '二级', '三级', '四级']
      },
      grid: { //图表的位置
          top: 30,
          left: 10,
          right: 80,
          bottom: 60,
          containLabel: true
      },
      dataZoom: [
          {
              type: 'inside'
          }, {
              type: 'slider',
              start: 0,
              bottom: 40,
              height: '15px',
              fillerColor:'rgba(202,223,255,.8)',
              borderColor:'#b6d2fc',
              handleStyle:{
                  color:'#b6d2fc'
              },
              dataBackground:{
                  lineStyle:{
                      color:'#b6d2fc'
                  },
                  areaStyle:{
                      color:'rgba(202,223,255,.8)'
                  }
              }
          }
      ],
      yAxis: [
          {
              type: 'value',
              name: '备案个数',
              nameTextStyle: {
                  fontSize: 12,
                  fontWeight: 'bold',
                  color: '#454545'
              },
              splitLine: {
                  show: false
              },
              axisLine: {
                  lineStyle: {
                      color: '#B3B3B3'
                  }
              },
              axisLabel: {
                  color: '#454545'
              }
          }
      ],
      xAxis: [
          {
              type: 'category',
              name: '区县名称',
              nameTextStyle: {
                  fontSize: 12,
                  fontWeight: 'bold',
                  color: '#454545'
              },
              axisLine: {
                  lineStyle: {
                      color: '#B3B3B3'
                  }
              },
              axisLabel: {
                  color: '#454545'
              },
              data: ['鼓楼区','玄武区','秦淮区']
          }
      ],
      series: [
          {
              name: '报警',
              type: 'bar',
              stack: '总量',
              barWidth: '10px',
              data: [1,2,4]
          }
      ]
  };
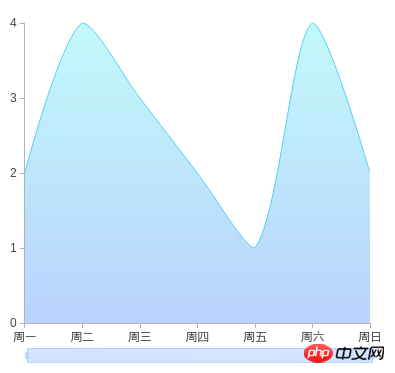
Graphique linéaire

//线图配置项
var option = {
      tooltip: {
          trigger: 'axis'
      },
      color: [
          new echarts.graphic.LinearGradient(
              0, 0, 0, 1,
              [
                  {offset: 0, color: '#23E9EE'},
                  {offset: 1, color: '#0460F7'}
              ]
          )
      ],
      grid: {
          top: 30,
          left: 10,
          right: 30,
          bottom: 50,
          containLabel: true
      },
      dataZoom: [
          {
              type: 'inside'
          }, {
              type: 'slider',
              start: 0,
              bottom: 30,
              height: '15px',
              fillerColor:'rgba(202,223,255,.8)',
              borderColor:'#b6d2fc',
              handleStyle:{
                  color:'#b6d2fc'
              },
              dataBackground:{
                  lineStyle:{
                      color:'#b6d2fc'
                  },
                  areaStyle:{
                      color:'rgba(202,223,255,.8)'
                  }
              }
          }
      ],
      yAxis: [
          {
              type: 'value',
              splitLine: {
                  show: false
              },
              axisLine: {
                  lineStyle: {
                      color: '#B3B3B3'
                  }
              },
              axisLabel: {
                  color: '#454545'
              }
          }
      ],
      xAxis: {
          type: 'category',
          boundaryGap:false,
          axisLine: {
              lineStyle: {
                  color: '#B3B3B3'
              }
          },
          axisLabel: {
              color: '#454545'
          },
          data: ['周一', '周二', '周三', '周四', '周五', '周六', '周日']
      },
      series: [
          {
              name: '报警个数',
              type: 'line',
              symbol: 'emptyCircle',
              symbolSize: 2,
              showSymbol: false,
              smooth: true,
              areaStyle: {
                  color: new echarts.graphic.LinearGradient(
                      0, 0, 0, 1,
                      [
                          {offset: 0, color: 'rgba(35,233,238,.4)'},
                          {offset: 1, color: 'rgba(4,96,247,.4)'}
                      ]
                  )
              },
              lineStyle: {
                  width: 1,
                  color: '#59cef5'
              },
              itemStyle: {
                  borderColor: '#59cef5',
                  borderWidth: 2
              },
              data:[2,4,3,2,1,4,2]
          }
      ]
  }
Créer une instance
var chart = echarts.init(document.getElementById('chartBox'));
Définir les éléments de configuration du graphique instance
Définir le graphique Éléments de configuration et données de l'instance, interface universelle, tous les paramètres et modifications de données peuvent être complétés via setOption. ECharts fusionnera les nouveaux paramètres et données, puis actualisera le graphiquechart.setOption(option);
<.>
Ce qui précède est le contenu détaillé de. pour plus d'informations, suivez d'autres articles connexes sur le site Web de PHP en chinois!
Déclaration:
Cet article est reproduit dans:. en cas de violation, veuillez contacter admin@php.cn Supprimer
Article précédent:Qu’est-ce que le format JSON ? Comment ouvrir un fichier au format json ?Article suivant:Qu’est-ce que le format JSON ? Comment ouvrir un fichier au format json ?
Articles Liés
Voir plus- Explication détaillée de l'ajout de l'utilisation des graphiques Echarts dans vue
- Comment utiliser les graphiques Echarts dans Angular2.0/4.0
- Concernant la question de la largeur : échec à 100 % du graphique echarts sur la page à onglet
- Synthèse de l'expérience dans l'utilisation des graphiques echarts (éviter les pièges)

