Maison >interface Web >Tutoriel H5 >Dessinez un graphique à barres à l'aide de HTML5 Canvas
Dessinez un graphique à barres à l'aide de HTML5 Canvas
- 阿神original
- 2017-03-21 10:08:344241parcourir
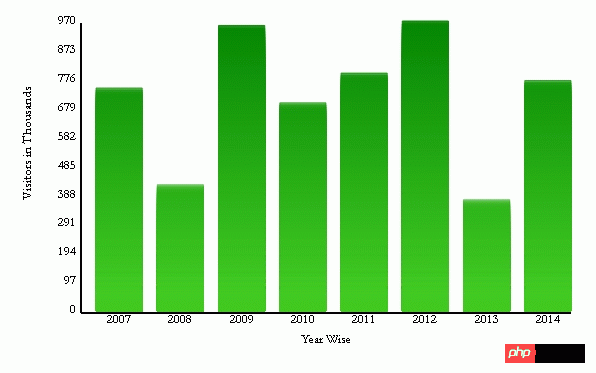
Rendu :

<!DOCTYPE>
<html>
<head>
<title>Bring Your Charts to Life</title>
<script type="text/javascript">
// chart sample data
var arrVisitors = new Array();
arrVisitors[0] = "2007, 750";
arrVisitors[1] = "2008, 425";
arrVisitors[2] = "2009, 960";
arrVisitors[3] = "2010, 700";
arrVisitors[4] = "2011, 800";
arrVisitors[5] = "2012, 975";
arrVisitors[6] = "2013, 375";
arrVisitors[7] = "2014, 775";
var canvas;
var context;
// chart properties
var cWidth, cHeight, cMargin, cSpace;
var cMarginSpace, cMarginHeight;
// bar properties
var bWidth, bMargin, totalBars, maxDataValue;
var bWidthMargin;
// bar animation
var ctr, numctr, speed;
// axis property
var totLabelsOnYAxis;
// barchart constructor
function barChart() {
canvas = document.getElementById('bchart');
if (canvas && canvas.getContext) {
context = canvas.getContext('2d');
}
chartSettings();
drawAxisLabelMarkers();
drawChartWithAnimation();
}
// initialize the chart and bar values
function chartSettings() {
// chart properties
cMargin = 25;
cSpace = 60;
cHeight = canvas.height - 2 * cMargin - cSpace;
cWidth = canvas.width - 2 * cMargin - cSpace;
cMarginSpace = cMargin + cSpace;
cMarginHeight = cMargin + cHeight;
// bar properties
bMargin = 15;
totalBars = arrVisitors.length;
bWidth = (cWidth / totalBars) - bMargin;
// find maximum value to plot on chart
maxDataValue = 0;
for (var i = 0; i < totalBars; i++) {
var arrVal = arrVisitors[i].split(",");
var barVal = parseInt(arrVal[1]);
if (parseInt(barVal) > parseInt(maxDataValue))
maxDataValue = barVal;
}
totLabelsOnYAxis = 10;
context.font = "10pt Garamond";
// initialize Animation variables
ctr = 0;
numctr = 100;
speed = 10;
}
// draw chart axis, labels and markers
function drawAxisLabelMarkers() {
context.lineWidth = "2.0";
// draw y axis
drawAxis(cMarginSpace, cMarginHeight, cMarginSpace, cMargin);
// draw x axis
drawAxis(cMarginSpace, cMarginHeight, cMarginSpace + cWidth, cMarginHeight);
context.lineWidth = "1.0";
drawMarkers();
}
// draw X and Y axis
function drawAxis(x, y, X, Y) {
context.beginPath();
context.moveTo(x, y);
context.lineTo(X, Y);
context.closePath();
context.stroke();
}
// draw chart markers on X and Y Axis
function drawMarkers() {
var numMarkers = parseInt(maxDataValue / totLabelsOnYAxis);
context.textAlign = "right";
context.fillStyle = "#000";;
// Y Axis
for (var i = 0; i <= totLabelsOnYAxis; i++) {
markerVal = i * numMarkers;
markerValHt = i * numMarkers * cHeight;
var xMarkers = cMarginSpace - 5;
var yMarkers = cMarginHeight - (markerValHt / maxDataValue);
context.fillText(markerVal, xMarkers, yMarkers, cSpace);
}
// X Axis
context.textAlign = 'center';
for (var i = 0; i < totalBars; i++) {
arrval = arrVisitors[i].split(",");
name = arrval[0];
markerXPos = cMarginSpace + bMargin
+ (i * (bWidth + bMargin)) + (bWidth/2);
markerYPos = cMarginHeight + 10;
context.fillText(name, markerXPos, markerYPos, bWidth);
}
context.save();
// Add Y Axis title
context.translate(cMargin + 10, cHeight / 2);
context.rotate(Math.PI * -90 / 180);
context.fillText('Visitors in Thousands', 0, 0);
context.restore();
// Add X Axis Title
context.fillText('Year Wise', cMarginSpace +
(cWidth / 2), cMarginHeight + 30 );
}
function drawChartWithAnimation() {
// Loop through the total bars and draw
for (var i = 0; i < totalBars; i++) {
var arrVal = arrVisitors[i].split(",");
bVal = parseInt(arrVal[1]);
bHt = (bVal * cHeight / maxDataValue) / numctr * ctr;
bX = cMarginSpace + (i * (bWidth + bMargin)) + bMargin;
bY = cMarginHeight - bHt - 2;
drawRectangle(bX, bY, bWidth, bHt, true);
}
// timeout runs and checks if bars have reached
// the desired height; if not, keep growing
if (ctr < numctr) {
ctr = ctr + 1;
setTimeout(arguments.callee, speed);
}
}
function drawRectangle(x, y, w, h, fill) {
context.beginPath();
context.rect(x, y, w, h);
context.closePath();
context.stroke();
if (fill) {
var gradient = context.createLinearGradient(0, 0, 0, 300);
gradient.addColorStop(0, 'green');
gradient.addColorStop(1, 'rgba(67,203,36,.15)');
context.fillStyle = gradient;
context.strokeStyle = gradient;
context.fill();
}
}
</script>
<noscript>
This chart is unavailable because JavaScript is disabled on your computer. Please enable
JavaScript and refresh this page to see the chart in action.
</noscript>
</head>
<body onLoad="barChart();">
<canvas id="bchart" height="400" width="600">Your browser does not support HTML5 Canvas
</canvas>
</body>
</html>Articles connexes :
Exemple de code pour HTML5 pour générer un effet d'histogramme (graphique à barres)
Utilisez HTML pour obtenir un effet d'histogramme simple
Ce qui précède est le contenu détaillé de. pour plus d'informations, suivez d'autres articles connexes sur le site Web de PHP en chinois!
Déclaration:
Le contenu de cet article est volontairement contribué par les internautes et les droits d'auteur appartiennent à l'auteur original. Ce site n'assume aucune responsabilité légale correspondante. Si vous trouvez un contenu suspecté de plagiat ou de contrefaçon, veuillez contacter admin@php.cn
Article précédent:Utilisez HTML5/CSS3 pour créer rapidement des exemples de code d'effets spéciaux pour les notes autocollantes en cinq étapes (images et texte)Article suivant:Utilisez HTML5/CSS3 pour créer rapidement des exemples de code d'effets spéciaux pour les notes autocollantes en cinq étapes (images et texte)
Articles Liés
Voir plus- Le plug-in de défilement plein écran AlloyTouch crée une page H5 fluide en 30 secondes
- Combat réel HTML5 et analyse des événements tactiles (touchstart, touchmove et touchend)
- Explication détaillée des exemples de dessin d'images dans le canevas HTML5 9
- Expressions régulières et nouveaux éléments HTML5
- Comment combiner NodeJS et HTML5 pour glisser-déposer plusieurs fichiers à télécharger sur le serveur

