Home >Software Tutorial >Office Software >How to insert a donut chart in WPS2019_How to insert a donut chart in WPS2019
How to insert a donut chart in WPS2019_How to insert a donut chart in WPS2019
- PHPzforward
- 2024-04-25 11:58:111106browse
The donut chart in WPS 2019 is a chart that displays the relative shares of data and is often used to compare the composition ratios of different parts. The process of making a donut chart can be a bit difficult, and this guide will provide you with detailed steps from inserting a donut chart to customizing its appearance. By reading the following, you will be able to easily create beautiful and effective donut charts in WPS 2019.
First, we open our computer, and then we open wps2019 text.

After that we click insert.

Then we click on the chart.

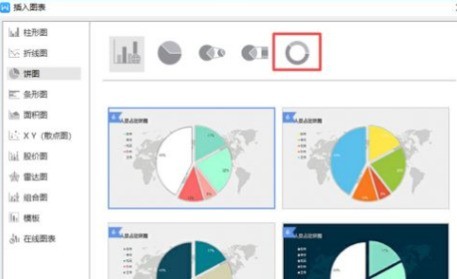
After that we click on the pie chart.

Then we click on the donut chart.

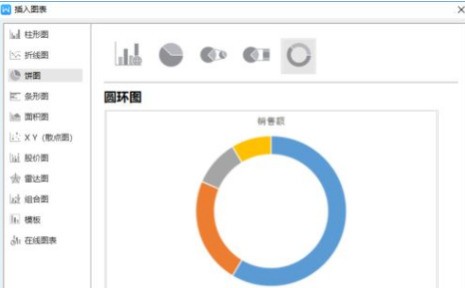
After that we can see a donut chart in the document.

Then we click on the blank space.

The result is as shown in the figure, so we have inserted a donut chart.

The above is the detailed content of How to insert a donut chart in WPS2019_How to insert a donut chart in WPS2019. For more information, please follow other related articles on the PHP Chinese website!

