Home >Software Tutorial >Office Software >Tutorial on how to set the starting point of the coordinate axis not to be 0 in Excel line chart
Tutorial on how to set the starting point of the coordinate axis not to be 0 in Excel line chart
- 王林forward
- 2024-03-29 14:01:05763browse
php editor Xinyi introduces you to the tutorial on how to set the starting point of the coordinate axis to not be 0 in Excel line chart. In Excel, adjusting the starting point of the coordinate axis of the line chart to not be 0 can more clearly display the data change trend, but the operation method is not so intuitive. Through this tutorial, you will learn how to easily set the starting point of the axis of an Excel line chart to make your data chart more expressive and accurate.
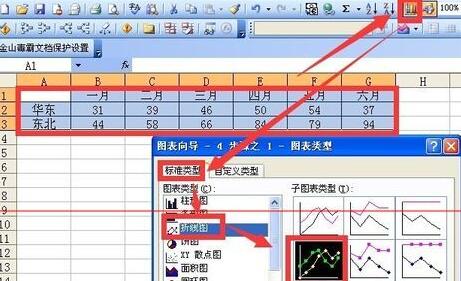
1. As shown in the figure, there is a data source table consisting of two rows of data. Select this area and use the menu bar chart wizard to generate a line chart. Just click Finish.
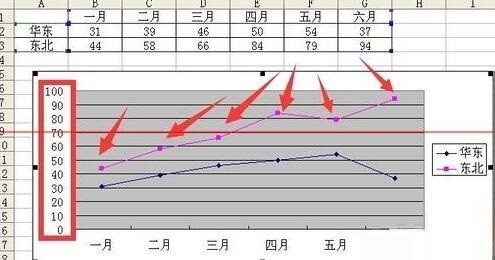
2. This is a generated line chart containing two series. It can be observed that the starting point of the coordinate axis is 0, and the data points on the line are not marked.
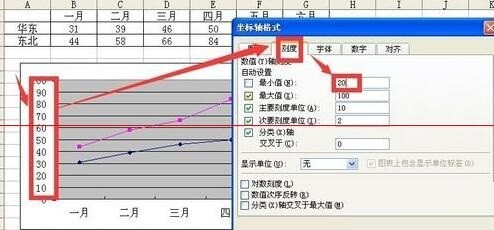
3. You can call up the coordinate axis format by double-clicking the coordinate axis, and set it to 20 under the minimum value of the scale tab.
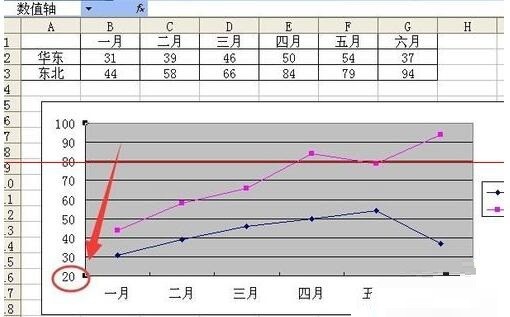
4. Click OK to view the effect. The starting point of the coordinates has changed to 20.
5. Double-click the upper polyline to bring up the data series format dialog box. Check the value on the data label selection card so that the data points can be marked.
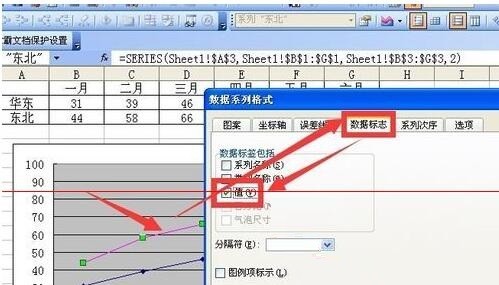
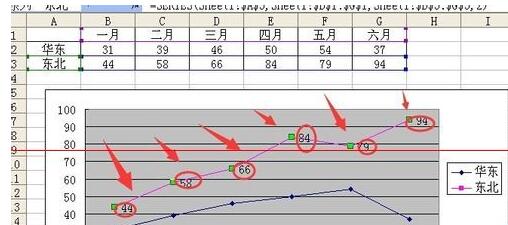
6. After clicking OK, observe that the discounted data points above have been marked with corresponding values, but some of the marked positions coincide with the polyline.
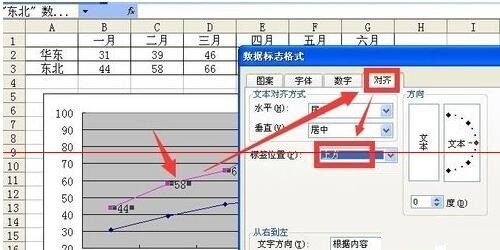
7. Double-click any data point to bring up the data mark format dialog box. Select the lower card for alignment and select the upper label position, so that the data mark of the data point can be placed. It's above the fold line.
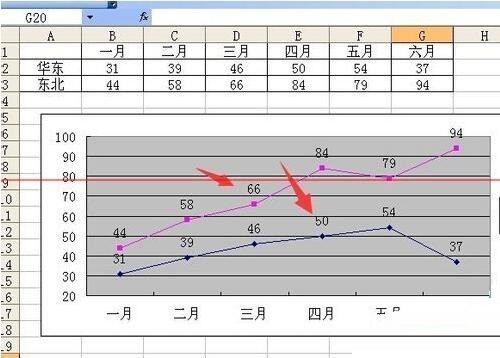
8. After clicking OK, use the same method to do the same for the polyline series below. The final effect is as follows. The coordinate axis starts from 20, and data marks appear on the data points.
The above is the detailed content of Tutorial on how to set the starting point of the coordinate axis not to be 0 in Excel line chart. For more information, please follow other related articles on the PHP Chinese website!

