


How to use a microscope in PowerPoint
Hello, what you are talking about should be the view of the microscope from a human perspective, right?
First of all, we need to clarify the process: start with a bright white field of view and gradually see the image you want to see. Now let's learn how to solve the puzzle in detail.
Before making PPT, you need to use drawing software to make two circles of the same size. One circle is the highlighted white field of view that represents the starting field of view; the other circle is the field of view of the final image you want to see. Now, I will provide you with detailed instructions for making (taking PPT2003 as an example):
Insert the visual field diagram into the slide, you can do it by following the steps: First, click the "Insert" tab, then select "Picture" and select the two circular visual field diagrams you made from the file. Next, insert the two visual field diagrams into the same slide. This will allow them to be displayed in a slideshow.
2. Right-click on the blank area of the slide - Background - select black, which is the same color as the surrounding field of view when viewing the microscope, making it appear more realistic.
3. Place the two inserted circles overlappingly in the center of the slide.
4. Place the white field of view picture on top of the final field of view picture (stacking order - move up one layer)
5. Select white field of view picture-slide show-custom animation
6. A custom animation bar will appear on the right, select Add Effect-Exit-Other Effects-Subtle-Gradient
7. Set speed to - very slow.
This completes the production process.
Try showing it. When you click the left mouse button, you will see that the white field of view gradually changes to the field of view you want to see, just like you are looking at a microscope while turning the coarse focus screw.
Try it, you will definitely succeed. If you have any questions, welcome HI, or email zyylove1985@163.com
I hope I can help you.
How to use PPT to create microscope animation special effects
Basic principle: When using a microscope to observe an object, you can only see the scenery in the circular area; of course, if the observation angle changes, the scenery we observe in the circular area will also be different. We only need to create a transparent picture in PNG format and import it into the PPT document, then import the picture that needs to be observed into the PPT document, and finally set the animation effect for the picture that needs to be observed, and then we can realize the animation of observing objects through the microscope. Special effects.
1. Production of transparent pictures
Step one: Start PowerPoint 2003 (the operation is similar for other versions), delete all elements in the slide that opens by default, then select the "Rectangle" control in the "Drawing" toolbar, and insert a Rectangle, resize the rectangle so that it is exactly the same size as the slide.
Step 2: Right-click the rectangle, select "Format AutoShape", switch to the "Color and Lines" tab, set the fill color to "Black", and select the "Ellipse" control in the "Drawing" toolbar , insert a circle in the center of the black rectangle and adjust the size, then set the fill color of the circle to "white" (Figure 1), then select the rectangle and circle in Figure 1 at the same time and right-click, select " Group → Group" to combine them into one piece, and finally copy Slide 1 in Figure 1A and paste it as Slide 2.

Step 3: Right-click on the graphics that have been combined together in the slide, select "Cut", then click the menu "Edit → Paste Special" command, and select in the pop-up "Paste Special" dialog box "Picture (PNG)" option, at this time the graphics in the slide have become pictures in PNG format.
Step 4: Click the menu "View→Toolbar→Picture" command, select the "Set Transparent Color" button, and then click anywhere in the slide, so that the circular area in the slide becomes To make it transparent, finally right-click the picture, select "Save as Picture", and save the picture to any location on the hard disk with the file name of "Microscope.PNG".
2. Production of animation special effects
Step one: Close and re-run PowerPoint 2003, and create a new microscope animation special effects.PPT. Click the menu "Insert→Picture→From File" command, insert the transparent picture "Microscope.PNG", then insert the picture of the object that the microscope needs to observe and adjust the size of the picture so that it just covers "Microscope.PNG".
Step 2: First select the picture of the object that needs to be observed by the inserted microscope, then click the menu "Slide Show → Custom Animation" command to open the "Custom Animation" panel, and then click "Add" in the panel Click the "Effect" button, select "Action Path→Draw Custom Path→Curve", and finally draw a curve on the image of the object to be observed by the microscope and move the curve to the center of the slide, as shown in Figure 2A.

Step 3: In the "Custom Animation" panel, first select the "Picture 1" label shown in Figure 2B and click the drop-down arrow to the right of "Start", set the parameters to "Before", and then follow In the same way, set the parameter on the right side of "Speed" to "Very Slow". Finally, select the image of the object that needs to be observed by the microscope, click the "Add Effect" button in the "Custom Animation" panel, and select "Emphasis → Zoom/ Zoom out" to add a zoom-in/zoom-out animation effect to the image.
Step 4: Select the newly added "Picture 1" label in the "Custom Animation" panel (below Figure 2B), first change the parameters after "Start" to "After", and then right-click on the slideshow For pictures of objects that need to be observed by the microscope in the film, select "Stacking Order → Place on Bottom", and finally press the F5 shortcut key to enjoy the vivid microscope animation effects.

How to enlarge and display parts of WPS2009 slides
During the playback of wps2009 slides, you may encounter some points that the audience is particularly concerned about. At this time, in order to enhance the explanation effect, it is necessary to temporarily enlarge and display these key points in the WPS2009 slides.
The operation method is as follows:
Right-click the mouse during the WPS slide show, select "Use Magnifying Glass" in the shortcut menu, and a zoom window will be displayed in the lower right corner of the screen. In this window, click the " " key to zoom in on the current slide, and click the "-" key to zoom out. Click the "=" key or click the left or right mouse button directly on the slide to quickly restore the original size. The entire slide thumbnail and a red box will also be displayed in the zoom window. The red box is the area displayed on the screen. Drag the red box directly to freely adjust the slide area to be displayed.
Hold down the Ctrl key and then press the ↑ and ↓ keys on the keyboard or roll the mouse wheel to zoom in or out of the WPS slideshow, but the zoom window will not be displayed when zooming in this way. In addition, after zooming in on the slide, you can also adjust the area to be displayed by pressing the →, ←, ↑, ↓ keys on the keyboard or directly holding down the left mouse button and dragging on the displayed WPS slide.
The above is the detailed content of How to add a microscope to PowerPoint. For more information, please follow other related articles on the PHP Chinese website!

 How to Reduce the Gaps Between Bars and Columns in Excel Charts (And Why You Should)Mar 08, 2025 am 03:01 AM
Enhance Your Excel Charts: Reducing Gaps Between Bars and Columns Presenting data visually in charts significantly improves spreadsheet readability. Excel excels at chart creation, but its extensive menus can obscure simple yet powerful features, suc
 5 Things You Can Do in Excel for the Web Today That You Couldn't 12 Months AgoMar 22, 2025 am 03:03 AM
Excel web version features enhancements to improve efficiency! While Excel desktop version is more powerful, the web version has also been significantly improved over the past year. This article will focus on five key improvements: Easily insert rows and columns: In Excel web, just hover over the row or column header and click the " " sign that appears to insert a new row or column. There is no need to use the confusing right-click menu "insert" function anymore. This method is faster, and newly inserted rows or columns inherit the format of adjacent cells. Export as CSV files: Excel now supports exporting worksheets as CSV files for easy data transfer and compatibility with other software. Click "File" > "Export"
 How to Use the AVERAGEIF and AVERAGEIFS Functions in ExcelMar 07, 2025 am 06:03 AM
Quick View of AVERAGEIF and AVERAGEIFS Functions in Excel Excel's AVERAGEIF and AVERAGEIFS functions can be used to calculate the average value of a dataset. However, unlike simpler AVERAGE functions, they are able to include or exclude specific values in the calculation. How to use the AVERAGEIF function in Excel Excel's AVERAGEIF function allows you to calculate the average value of a filtered dataset based on a single condition set. AVERAGEIF function syntax The AVERAGEIF function contains three parameters: =AVERAGEIF(x,y,z)
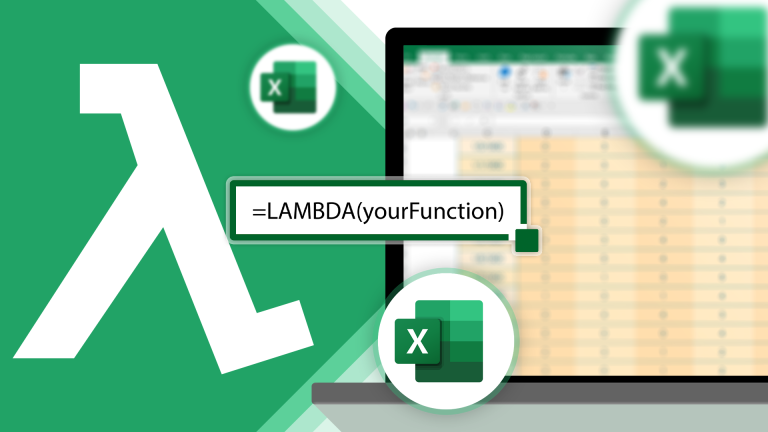 How to Use LAMBDA in Excel to Create Your Own FunctionsMar 21, 2025 am 03:08 AM
Excel's LAMBDA Functions: An easy guide to creating custom functions Before Excel introduced the LAMBDA function, creating a custom function requires VBA or macro. Now, with LAMBDA, you can easily implement it using the familiar Excel syntax. This guide will guide you step by step how to use the LAMBDA function. It is recommended that you read the parts of this guide in order, first understand the grammar and simple examples, and then learn practical applications. The LAMBDA function is available for Microsoft 365 (Windows and Mac), Excel 2024 (Windows and Mac), and Excel for the web. E
 Microsoft Excel Keyboard Shortcuts: Printable Cheat SheetMar 14, 2025 am 12:06 AM
Master Microsoft Excel with these essential keyboard shortcuts! This cheat sheet provides quick access to the most frequently used commands, saving you valuable time and effort. It covers essential key combinations, Paste Special functions, workboo
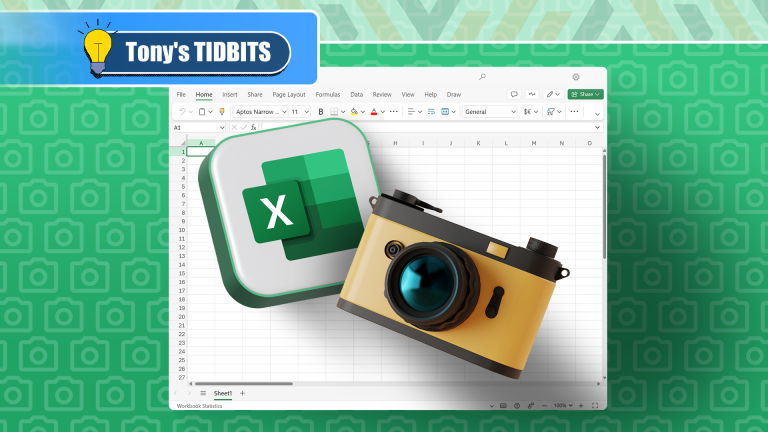 If You Don't Use Excel's Hidden Camera Tool, You're Missing a TrickMar 25, 2025 am 02:48 AM
Quick Links Why Use the Camera Tool?
 Use the PERCENTOF Function to Simplify Percentage Calculations in ExcelMar 27, 2025 am 03:03 AM
Excel's PERCENTOF function: Easily calculate the proportion of data subsets Excel's PERCENTOF function can quickly calculate the proportion of data subsets in the entire data set, avoiding the hassle of creating complex formulas. PERCENTOF function syntax The PERCENTOF function has two parameters: =PERCENTOF(a,b) in: a (required) is a subset of data that forms part of the entire data set; b (required) is the entire dataset. In other words, the PERCENTOF function calculates the percentage of the subset a to the total dataset b. Calculate the proportion of individual values using PERCENTOF The easiest way to use the PERCENTOF function is to calculate the single
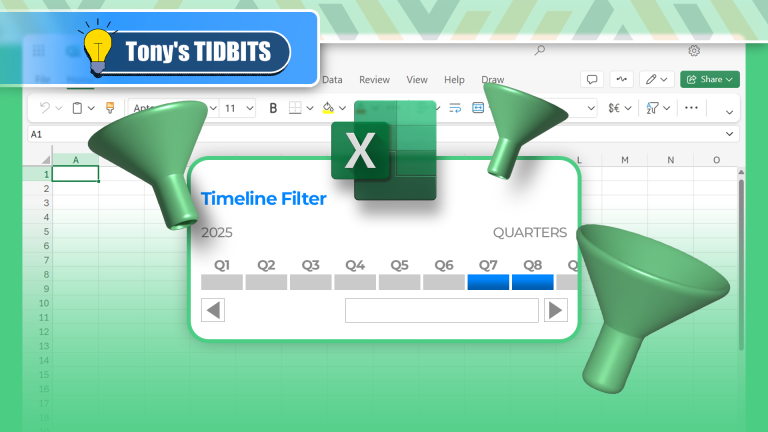 How to Create a Timeline Filter in ExcelApr 03, 2025 am 03:51 AM
In Excel, using the timeline filter can display data by time period more efficiently, which is more convenient than using the filter button. The Timeline is a dynamic filtering option that allows you to quickly display data for a single date, month, quarter, or year. Step 1: Convert data to pivot table First, convert the original Excel data into a pivot table. Select any cell in the data table (formatted or not) and click PivotTable on the Insert tab of the ribbon. Related: How to Create Pivot Tables in Microsoft Excel Don't be intimidated by the pivot table! We will teach you basic skills that you can master in minutes. Related Articles In the dialog box, make sure the entire data range is selected (


Hot AI Tools

Undresser.AI Undress
AI-powered app for creating realistic nude photos

AI Clothes Remover
Online AI tool for removing clothes from photos.

Undress AI Tool
Undress images for free

Clothoff.io
AI clothes remover

AI Hentai Generator
Generate AI Hentai for free.

Hot Article
Hot Tools

PhpStorm Mac version
The latest (2018.2.1) professional PHP integrated development tool

DVWA
Damn Vulnerable Web App (DVWA) is a PHP/MySQL web application that is very vulnerable. Its main goals are to be an aid for security professionals to test their skills and tools in a legal environment, to help web developers better understand the process of securing web applications, and to help teachers/students teach/learn in a classroom environment Web application security. The goal of DVWA is to practice some of the most common web vulnerabilities through a simple and straightforward interface, with varying degrees of difficulty. Please note that this software

SecLists
SecLists is the ultimate security tester's companion. It is a collection of various types of lists that are frequently used during security assessments, all in one place. SecLists helps make security testing more efficient and productive by conveniently providing all the lists a security tester might need. List types include usernames, passwords, URLs, fuzzing payloads, sensitive data patterns, web shells, and more. The tester can simply pull this repository onto a new test machine and he will have access to every type of list he needs.

Safe Exam Browser
Safe Exam Browser is a secure browser environment for taking online exams securely. This software turns any computer into a secure workstation. It controls access to any utility and prevents students from using unauthorized resources.

MinGW - Minimalist GNU for Windows
This project is in the process of being migrated to osdn.net/projects/mingw, you can continue to follow us there. MinGW: A native Windows port of the GNU Compiler Collection (GCC), freely distributable import libraries and header files for building native Windows applications; includes extensions to the MSVC runtime to support C99 functionality. All MinGW software can run on 64-bit Windows platforms.

