

 Backend DevelopmentPython TutorialHow to implement decision tree classification algorithm in python
Pre-information
1. Decision tree
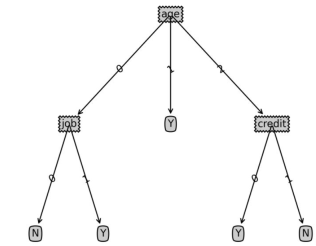
The rewritten sentence: In supervised learning, a commonly used classification algorithm is decision tree, which is based on a batch of samples, each sample contains a set of attributes and corresponding classification results. Using these samples for learning, the algorithm can generate a decision tree that can correctly classify new data
2. Sample data
Assume that there are 14 existing users, and their personal attributes The data on whether to purchase a certain product is as follows:
| Age | Income range | Type of work | Credit Rating | Purchasing Decision | ||||||||||||
|---|---|---|---|---|---|---|---|---|---|---|---|---|---|---|---|---|
| High | Unstable | Poor | No | |||||||||||||
| 高 | Unstable | Good | No | |||||||||||||
| 30-40 | High | Unstable | Poor | is | ||||||||||||
| >40 | Medium | Unstable | Poor | Yes | ||||||||||||
| >40 | Low | Stable | Poor | Yes | ||||||||||||
| > 40 | Low | Stable | Good | No | ||||||||||||
| 30- 40 | Low | Stable | Good | Yes | ||||||||||||
| Medium | Unstable | Poor | No | |||||||||||||
| Low | Stable | Poor | is | |||||||||||||
| >40 | Medium | Stable | Poor | Yes | ##11 | |||||||||||
| Stable | Good | Yes | ##12 | |||||||||||||
| Medium | Unstable | Good | Yes | 13 | ||||||||||||
| High | Stable | Poor | is | 14 | ||||||||||||
| Medium | Unstable | Good | No | ## |
| Income range | Nature of work | Credit rating | Low | Stable | Good | High | Unstable | Good |
|---|
result1: NPost information: Drawing decision tree code
The following code is used to draw decision tree graphics, not the focus of the decision tree algorithm. If you are interested, you can refer to it for learning
import matplotlib.pyplot as plt

decisionNode = dict(box, fc="0.8")
leafNode = dict(box, fc="0.8")
arrow_args = dict(arrow)

#获取叶节点的数目
def getNumLeafs(myTree):
    numLeafs = 0
    firstStr = list(myTree.keys())[0]
    secondDict = myTree[firstStr]
    for key in secondDict.keys():
        if type(secondDict[key]).__name__=='dict':#测试节点的数据是否为字典,以此判断是否为叶节点
            numLeafs += getNumLeafs(secondDict[key])
        else:   numLeafs +=1
    return numLeafs

#获取树的层数
def getTreeDepth(myTree):
    maxDepth = 0
    firstStr = list(myTree.keys())[0]
    secondDict = myTree[firstStr]
    for key in secondDict.keys():
        if type(secondDict[key]).__name__=='dict':#测试节点的数据是否为字典,以此判断是否为叶节点
            thisDepth = 1 + getTreeDepth(secondDict[key])
        else:   thisDepth = 1
        if thisDepth > maxDepth: maxDepth = thisDepth
    return maxDepth

#绘制节点
def plotNode(nodeTxt, centerPt, parentPt, nodeType):
    createPlot.ax1.annotate(nodeTxt, xy=parentPt,  xycoords='axes fraction',
             xytext=centerPt, textcoords='axes fraction',
             va="center", ha="center", bbox=nodeType, arrowprops=arrow_args )

#绘制连接线
def plotMidText(cntrPt, parentPt, txtString):
    xMid = (parentPt[0]-cntrPt[0])/2.0 + cntrPt[0]
    yMid = (parentPt[1]-cntrPt[1])/2.0 + cntrPt[1]
    createPlot.ax1.text(xMid, yMid, txtString, va="center", ha="center", rotation=30)

#绘制树结构
def plotTree(myTree, parentPt, nodeTxt):#if the first key tells you what feat was split on
    numLeafs = getNumLeafs(myTree)  #this determines the x width of this tree
    depth = getTreeDepth(myTree)
    firstStr = list(myTree.keys())[0]     #the text label for this node should be this
    cntrPt = (plotTree.xOff + (1.0 + float(numLeafs))/2.0/plotTree.totalW, plotTree.yOff)
    plotMidText(cntrPt, parentPt, nodeTxt)
    plotNode(firstStr, cntrPt, parentPt, decisionNode)
    secondDict = myTree[firstStr]
    plotTree.yOff = plotTree.yOff - 1.0/plotTree.totalD
    for key in secondDict.keys():
        if type(secondDict[key]).__name__=='dict':#test to see if the nodes are dictonaires, if not they are leaf nodes
            plotTree(secondDict[key],cntrPt,str(key))        #recursion
        else:   #it's a leaf node print the leaf node
            plotTree.xOff = plotTree.xOff + 1.0/plotTree.totalW
            plotNode(secondDict[key], (plotTree.xOff, plotTree.yOff), cntrPt, leafNode)
            plotMidText((plotTree.xOff, plotTree.yOff), cntrPt, str(key))
    plotTree.yOff = plotTree.yOff + 1.0/plotTree.totalD

#创建决策树图形
def createPlot(inTree):
    fig = plt.figure(1, facecolor='white')
    fig.clf()
    axprops = dict(xticks=[], yticks=[])
    createPlot.ax1 = plt.subplot(111, frameon=False, **axprops)    #no ticks
    #createPlot.ax1 = plt.subplot(111, frameon=False) #ticks for demo puropses
    plotTree.totalW = float(getNumLeafs(inTree))
    plotTree.totalD = float(getTreeDepth(inTree))
    plotTree.xOff = -0.5/plotTree.totalW; plotTree.yOff = 1.0;
    plotTree(inTree, (0.5,1.0), '')
    plt.savefig('决策树.png',dpi=300,bbox_inches='tight')
    plt.show()
The above is the detailed content of How to implement decision tree classification algorithm in python. For more information, please follow other related articles on the PHP Chinese website!

 What are some common reasons why a Python script might not execute on Unix?Apr 28, 2025 am 12:18 AM
The reasons why Python scripts cannot run on Unix systems include: 1) Insufficient permissions, using chmod xyour_script.py to grant execution permissions; 2) Shebang line is incorrect or missing, you should use #!/usr/bin/envpython; 3) The environment variables are not set properly, and you can print os.environ debugging; 4) Using the wrong Python version, you can specify the version on the Shebang line or the command line; 5) Dependency problems, using virtual environment to isolate dependencies; 6) Syntax errors, using python-mpy_compileyour_script.py to detect.
 Give an example of a scenario where using a Python array would be more appropriate than using a list.Apr 28, 2025 am 12:15 AM
Using Python arrays is more suitable for processing large amounts of numerical data than lists. 1) Arrays save more memory, 2) Arrays are faster to operate by numerical values, 3) Arrays force type consistency, 4) Arrays are compatible with C arrays, but are not as flexible and convenient as lists.
 What are the performance implications of using lists versus arrays in Python?Apr 28, 2025 am 12:10 AM
Listsare Better ForeflexibilityandMixdatatatypes, Whilearraysares Superior Sumerical Computation Sand Larged Datasets.1) Unselable List Xibility, MixedDatatypes, andfrequent elementchanges.2) Usarray's sensory -sensical operations, Largedatasets, AndwhenMemoryEfficiency
 How does NumPy handle memory management for large arrays?Apr 28, 2025 am 12:07 AM
NumPymanagesmemoryforlargearraysefficientlyusingviews,copies,andmemory-mappedfiles.1)Viewsallowslicingwithoutcopying,directlymodifyingtheoriginalarray.2)Copiescanbecreatedwiththecopy()methodforpreservingdata.3)Memory-mappedfileshandlemassivedatasetsb
 Which requires importing a module: lists or arrays?Apr 28, 2025 am 12:06 AM
ListsinPythondonotrequireimportingamodule,whilearraysfromthearraymoduledoneedanimport.1)Listsarebuilt-in,versatile,andcanholdmixeddatatypes.2)Arraysaremorememory-efficientfornumericdatabutlessflexible,requiringallelementstobeofthesametype.
 What data types can be stored in a Python array?Apr 27, 2025 am 12:11 AM
Pythonlistscanstoreanydatatype,arraymodulearraysstoreonetype,andNumPyarraysarefornumericalcomputations.1)Listsareversatilebutlessmemory-efficient.2)Arraymodulearraysarememory-efficientforhomogeneousdata.3)NumPyarraysareoptimizedforperformanceinscient
 What happens if you try to store a value of the wrong data type in a Python array?Apr 27, 2025 am 12:10 AM
WhenyouattempttostoreavalueofthewrongdatatypeinaPythonarray,you'llencounteraTypeError.Thisisduetothearraymodule'sstricttypeenforcement,whichrequiresallelementstobeofthesametypeasspecifiedbythetypecode.Forperformancereasons,arraysaremoreefficientthanl
 Which is part of the Python standard library: lists or arrays?Apr 27, 2025 am 12:03 AM
Pythonlistsarepartofthestandardlibrary,whilearraysarenot.Listsarebuilt-in,versatile,andusedforstoringcollections,whereasarraysareprovidedbythearraymoduleandlesscommonlyusedduetolimitedfunctionality.


Hot AI Tools

Undresser.AI Undress
AI-powered app for creating realistic nude photos

AI Clothes Remover
Online AI tool for removing clothes from photos.

Undress AI Tool
Undress images for free

Clothoff.io
AI clothes remover

Video Face Swap
Swap faces in any video effortlessly with our completely free AI face swap tool!

Hot Article
Hot Tools

SublimeText3 English version
Recommended: Win version, supports code prompts!

ZendStudio 13.5.1 Mac
Powerful PHP integrated development environment

Safe Exam Browser
Safe Exam Browser is a secure browser environment for taking online exams securely. This software turns any computer into a secure workstation. It controls access to any utility and prevents students from using unauthorized resources.

SublimeText3 Chinese version
Chinese version, very easy to use

EditPlus Chinese cracked version
Small size, syntax highlighting, does not support code prompt function

