
Home >Technology peripherals >AI >Convert time series into classification problem
Convert time series into classification problem

- WBOYWBOYWBOYWBOYWBOYWBOYWBOYWBOYWBOYWBOYWBOYWBOYWBforward
- 2023-05-18 22:12:201327browse
This article will use stock trading as an example. We use AI models to predict whether a stock will rise or fall the next day. In this context, three classification algorithms, XGBoost, Random Forest and Logistic Classifier, are compared. Another focus of the article is data preparation. How do we have to transform the data so that the model can process it.

This article will follow the steps of the CRISP-DM process model and use a structured approach to solve the business case. CRISP-DM is a widely used method in latent analysis and is often used in building data science projects.
The other thing is that we will use the Python package openbb. This package includes some data sources from the financial sector and is very easy to use.
The first step is to install the necessary libraries:
<code>pip install pandas numpy “openbb[all]” swifter scikit-learn</code>
Business understanding
First we should understand the problem we want to solve. In our example, the problem can be defined as follows:
<code>预测股票代码 AAPL 的股价第二天会上涨还是下跌。</code>
Then there is the question of what kind of machine learning model you should consider at hand. We want to predict whether the stock will go up or down the next day. So what we are dealing with here is a binary classification problem where we want to predict whether a stock will go up (with a value of 1) or go down (with a value of 0) the next day. In a classification problem, we predict a class. In our case, it’s a binary classification of classes 0 and 1.
Data Understanding and Preparation
The data understanding phase focuses on identifying, collecting, and analyzing data sets. As a first step, we download Apple stock data. Here's how to do it using openbb:
<code>data = openbb.stocks.load(symbol = 'AAPL',start_date = '2023-01-01',end_date = '2023-04-01',monthly = False) data</code>
This code downloads data between 2023-01-01 and 2023-04-01. The downloaded data contains the following information:
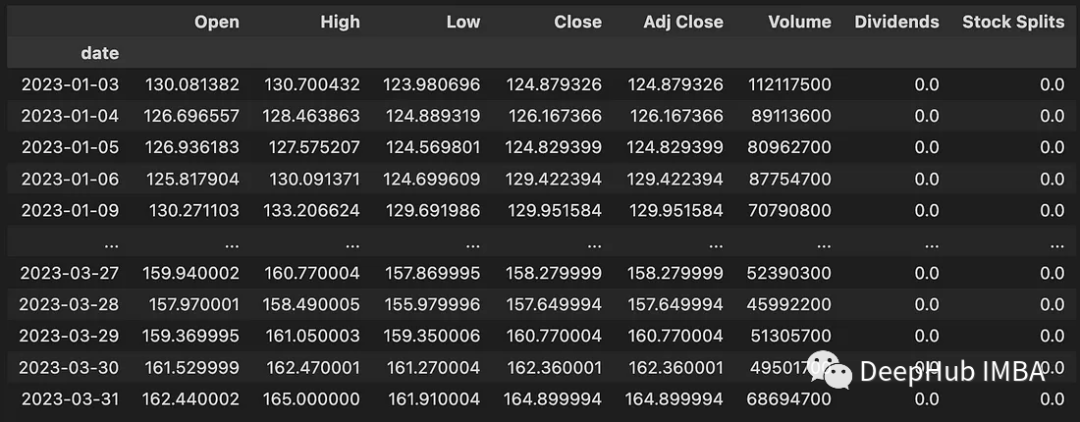
- Open: Daily opening price in US dollars
- High: Highest price of the day (USD)
- Low: Lowest price of the day (USD)
- Close: Daily closing price in USD
- Adj Close: Adjusted closing price related to dividends or stock splits
- Volume : Number of shares traded
- Dividends : Dividends paid
- Stock Splits : Stock split execution
We have downloaded the data, but the data is not yet suitable for modeling Classification model. So the data still needs to be prepared for modeling. Therefore, it is necessary to develop a function to download the data and then convert the data for modeling. The following code shows this function:
<code>def get_training_data(symbol, start_date, end_date, monthly_bool=True, lookback=10): data = openbb.stocks.load( symbol = symbol, start_date = start_date, end_date = end_date, monthly = monthly_bool) data = get_label(data) data_up_down = data['up_down'].to_numpy() training_data = get_sequence_data(data_up_down, lookback) return training_data</code>
The first function included here is get_label():
<code>def encoding(n): if n > 0: return 1 else: return 0 def get_label(data): data['Delta'] = data['Close'] - data['Open'] data['up_down'] = data['Delta'].swifter.apply(lambda d: encoding(d)) return data</code>
His main job is: calculate the difference between the closing price and the opening price value. We mark all days when the stock price increased as 1 and all days when the stock price fell as 0. The additional up_down column contains whether the stock price increased or decreased on a specific date. The swifter.apply() function is used here instead of pandas apply() because swifter provides multi-core support.
The second function is get_sequence_data(). The parameter lookback specifies how many days in the past are included in the forecast. The get_sequence_data() code is as follows:
<code>def get_sequence_data(data_up_down, lookback): shape = (data_up_down.shape[0] - lookback + 1, lookback) strides = data_up_down.strides + (data_up_down.strides[-1],) return np.lib.stride_tricks.as_strided(data_up_down, shape=shape, strides=strides)</code>
This function accepts two parameters: data_up_down and lookback. It returns a new NumPy array representing a sliding window view of the data_up_down array with the specified window size, determined by the lookback argument. To illustrate how this function works, let's look at a small example.
<code>get_sequence_data(np.array([1, 2, 3, 4, 5, 6]), 3)</code>
The results are as follows:
<code>array([[1, 2, 3],[2, 3, 4],[3, 4, 5],[4, 5, 6]])</code>
Below, we download the data for Apple stock and transform it for modelling. We use a 10-day lookback window.
<code>data = get_training_data(symbol = 'AAPL', start_date = '2023-01-01', end_date = '2023-04-01', monthly_bool = False, lookback=10) pd.DataFrame(data).to_csv("data/data_aapl.csv")</code>
The data has been prepared, we start modeling and evaluating the model.
Modeling
Read the data and generate test and training data.
<code>data = pandas.read_csv("./data/data_aapl.csv") X=data.iloc[:,:-1] Y=data.iloc[:,-1] X_train, X_test, y_train, y_test = train_test_split(X, Y, test_size=0.33, random_state=4284, stratify=Y)</code>
Logistic regression:
This classifier is a linear-based model and is often used as a baseline model. We use scikit-learn's implementation:
<code>model_lr = LogisticRegression(random_state = 42) model_lr.fit(X_train,y_train) y_pred = model_lr.predict(X_test)</code>
XGBoost:
XGBoost is an implementation of gradient boosted decision trees designed for speed and performance. It belongs to the tree boosting algorithm, which connects many weak tree classifiers in sequence.
<code>model_xgb = XGBClassifier(random_state = 42) model_xgb.fit(X_train, y_train) y_pred = model_xgb.predict(X_test)</code>
Random Forest:
Random forest builds multiple decision trees. The Bagging method is called a type of ensemble learning because it utilizes multiple interconnected learners for learning. The acronym "bagging" stands for bootstrap aggregation. The implementation of scikit-learn is also used here:
<code>model_rf = RandomForestClassifier(random_state = 42) model_rf.fit(X_train, y_train) y_pred = model_rf.predict(X_test)</code>
Evaluation
After modeling and training the model, we need to evaluate its performance on the test data. Recall, Precision and F1-Score are used to measure metrics. The table below shows the results.
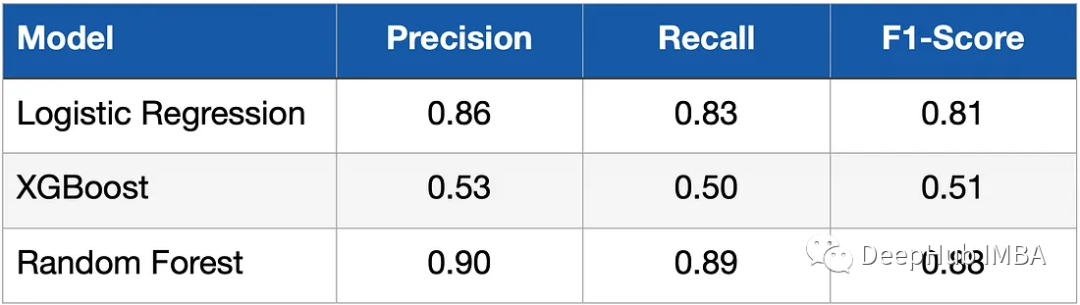
It can be seen that the logistic classifier (logistic regression) and random forest have achieved significantly better results than the XGBoost model. What is the reason for this? This is because the data is relatively simple, with only a few dimensions of features, and the length of the data is also very small, and all our models have not been tuned.
Summary
The main purpose of our article is to introduce how to convert the time series of stock prices into a classification problem, and to demonstrate how to use the window function to convert the time series into a sequence during data processing. As for The model doesn't have to be tuned much, so the simpler the model performs better for performance evaluation.
The above is the detailed content of Convert time series into classification problem. For more information, please follow other related articles on the PHP Chinese website!
Related articles
See more- Technology trends to watch in 2023
- How Artificial Intelligence is Bringing New Everyday Work to Data Center Teams
- Can artificial intelligence or automation solve the problem of low energy efficiency in buildings?
- OpenAI co-founder interviewed by Huang Renxun: GPT-4's reasoning capabilities have not yet reached expectations
- Microsoft's Bing surpasses Google in search traffic thanks to OpenAI technology