






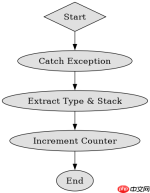
使用异常统计定位高频错误,核心做法是在应用启动时注册全局异常处理器(如 @controlleradvice 或 errorcontroller),在捕获到所有未处理异常后,提取异常类型、堆栈信息或自定义业务码,并调用指标库(如 micrometer)的计数器进行累加。这样可以在不侵入业务逻辑的前提下,通过监控面板实时查看哪些异常发生频率最高,从而快速锁定系统瓶颈。

如何配置全局异常拦截器以统一收集异常数据?
配置全局异常拦截的关键在于定义一个实现了 HandlerExceptionResolver 接口的组件,或者直接使用 Spring Boot 提供的 @RestControllerAdvice。在拦截方法中,通过 @ExceptionHandler 注解指定需要处理的异常类型,例如 Exception.class 可以捕获所有运行时异常。获取到异常对象后,利用 MeterRegistry 注入的计数器实例,调用 increment() 方法并将异常类名作为标签(Tag)传入。这种机制确保了无论异常发生在哪个 Controller 或 Service 层,都会被统一重定向到统计逻辑中,而不会中断正常的 HTTP 响应流程(如果选择返回特定错误页或 JSON)。
import io.micrometer.core.instrument.MeterRegistry;
import org.springframework.web.bind.annotation.ExceptionHandler;
import org.springframework.web.bind.annotation.RestControllerAdvice;

@RestControllerAdvice
public class GlobalExceptionHandler {
    private final MeterRegistry meterRegistry;

    public GlobalExceptionHandler(MeterRegistry meterRegistry) {
        this.meterRegistry = meterRegistry;
    }

    @ExceptionHandler(Exception.class)
    public void handleException(Exception e) {
        // 统计异常类型
        meterRegistry.counter("app.exceptions.total",
            "type", e.getClass().getSimpleName()).increment();

        // 可选:记录详细日志以便后续分析
        System.err.println("Caught exception: " + e.getMessage());
    }
}
上述代码展示了最基础的实现方式。当应用抛出任何 Exception 时,都会触发 handleException 方法。这里使用了 MeterRegistry 来生成名为 app.exceptions.total 的计数器,并通过 type 标签区分具体的异常子类。开发者可以通过 Prometheus 等监控系统查询该指标,按 type 排序即可找出出现次数最多的异常名称。注意,此示例仅用于统计,实际生产中可能需要根据业务需求决定是返回错误页面还是静默记录。
如何结合业务上下文细化异常分类统计?
仅仅统计异常类名往往不够精确,因为同一个异常可能由不同的业务场景引发。为了更精准地定位问题,需要在统计时加入业务维度的标签,例如模块名称、接口路径或用户 ID。这通常通过在拦截器中解析请求上下文来实现。例如,可以从 HttpServletRequest 中获取 URI,或者从自定义的 BusinessException 中提取错误码。将这些额外信息作为额外的 Tag 传递给计数器,可以实现多维度的聚合分析。比如,可以单独统计 /api/user 接口下的 NullPointerException 数量,从而缩小排查范围。


import jakarta.servlet.http.HttpServletRequest;
import org.springframework.web.bind.annotation.ExceptionHandler;
import org.springframework.web.bind.annotation.RestControllerAdvice;
import io.micrometer.core.instrument.MeterRegistry;

@RestControllerAdvice
public class DetailedExceptionHandler {
    private final MeterRegistry meterRegistry;

    public DetailedExceptionHandler(MeterRegistry meterRegistry) {
        this.meterRegistry = meterRegistry;
    }

    @ExceptionHandler(BusinessException.class)
    public void handleBusinessException(BusinessException e, HttpServletRequest request) {
        String uri = request.getRequestURI();
        String errorCode = e.getErrorCode();

        // 增加业务维度的统计标签
        meterRegistry.counter("app.business.errors",
            "uri", uri,
            "errorCode", errorCode).increment();
    }
}

class BusinessException extends RuntimeException {
    private final String errorCode;
    public BusinessException(String errorCode) { this.errorCode = errorCode; }
    public String getErrorCode() { return errorCode; }
}
在这个进阶示例中,我们定义了 BusinessException 并引入了 HttpServletRequest 参数。通过提取请求的 uri 和异常中的 errorCode,我们将统计粒度从单纯的异常类型扩展到了“接口+错误码”的组合。这意味着在监控系统中,你可以看到类似 app_business_errors_total{uri="/api/order", errorCode="INSUFFICIENT_STOCK"} 这样的指标。这种细粒度的数据对于快速定位特定业务逻辑中的高频故障至关重要,尤其是当某个特定操作频繁失败时,可以直接关联到具体的错误码进行修复。
基于程序中某个输入、条件或结果的具体问题
在实际运行中,如果某个特定的输入导致异常频率突然飙升,如何通过统计数据进行验证?假设我们的程序在处理用户登录时,当密码错误超过5次会抛出 AccountLockedException。通过观察监控面板上 app.exceptions.total 中 AccountLockedException 的计数曲线,如果发现该指标在短时间内急剧上升,且伴随大量来自同一 IP 的请求,则可以推断出可能存在暴力破解攻击或批量导入错误数据的脚本。此时,结合 DetailedExceptionHandler 中记录的 uri 标签,可以确认这些异常均来源于 /login 接口,从而迅速采取封禁 IP 或优化批量处理逻辑的措施。这种基于实时统计数据的反馈闭环,使得异常处理从被动记录转变为主动防御。
Java免费学习笔记:立即使用
解锁 Java 大师之旅:从入门到精通的终极指南


