

 Software TutorialOffice SoftwareThe PIVOTBY Function vs PivotTables: Which Should You Use in Excel?
Excel's PIVOTBY Function vs. PivotTables: A Detailed Comparison
Excel offers two powerful tools for data summarization and reorganization: the PIVOTBY function and PivotTables. Both group and aggregate data for detailed analysis, but their usage differs significantly. This article explores their strengths and weaknesses to help you choose the best tool for your needs.
Excel's PIVOTBY Function: Dynamic Array Power
PIVOTBY, a dynamic array function, uses formulas to create tabular summaries by grouping data rows and columns. Key features include:

Limited Compatibility: Introduced relatively recently (September 2024), PIVOTBY is currently only available in Excel for Microsoft 365 (Windows and Mac). Older Excel versions will display a #NAME? error.

Automatic Refresh: A major advantage is its automatic recalculation and resizing whenever the source data changes. This eliminates the need for manual refreshes (unlike PivotTables), ensuring you always see the latest data.
Extensive Customization: PIVOTBY offers unparalleled flexibility:
- Define row and column variables.
- Include or exclude headers.
- Use various Excel functions (including custom LAMBDA functions) for aggregation.
- Create hierarchical groupings.
- Sort data by rows and columns.
- Filter unwanted data.
- Convert totals to percentages.
This customization is all within a single function, unlike PivotTables which require navigating different panes and ribbon options. Furthermore, PIVOTBY works with both columnar and row-oriented source data, unlike PivotTables which require columnar data.
Formula Dependency: PIVOTBY's strength—its formula-based nature—can also be a limitation. Sharing a workbook with users unfamiliar with the function can cause issues if adjustments are needed. It's ideal for personal use or sharing with users who understand its functionality.

Excel PivotTables: The Established Champion
PivotTables are a long-standing and widely recognized Excel feature for analyzing large datasets. Key aspects include:

Wide Compatibility: Available in most Excel versions (Excel 2016 and later), including Microsoft Office, Excel for the web, and Excel for Microsoft 365, ensuring broad compatibility.
Designated User Interface: The intuitive PivotTable Fields pane simplifies data selection and organization into rows and columns. The Design and Analyze tabs provide easy access to customization options.


Manual Refresh: While requiring manual refreshes, this prevents the performance drain that constant recalculation in multiple PIVOTBY formulas can cause.

Efficient Formatting: Built-in formatting options clearly distinguish headers, data rows, subtotals, and grand totals. The Design tab offers quick style modifications.


Added Visualization: PivotTables integrate seamlessly with Timeline filters and PivotCharts for dynamic data visualization.

Diverse Data Sources: Excel 2016 and later versions allow PivotTables to connect to external data sources (databases, CSV, web pages, etc.), offering greater flexibility.

PIVOTBY vs. PivotTables: When to Use Which
PIVOTBY and PivotTables serve different purposes and aren't mutually exclusive. Consider these factors when choosing:
Use PIVOTBY if:
- Automatic data refresh is crucial.
- You prefer formula-based manipulation.
- Extensive customization is needed.
- You're comfortable with advanced Excel functions.
Use PivotTables if:
- Ease of use and quick data organization are priorities.
- Visualizations are important.
- Data sharing with less experienced users is necessary.
- You need to connect to diverse data sources.
The GROUPBY function, while also useful for data grouping, only works with rows, making it less versatile than PIVOTBY for creating comprehensive summaries.
The above is the detailed content of The PIVOTBY Function vs PivotTables: Which Should You Use in Excel?. For more information, please follow other related articles on the PHP Chinese website!

 The PIVOTBY Function vs PivotTables: Which Should You Use in Excel?Apr 23, 2025 am 01:07 AM
Excel's PIVOTBY Function vs. PivotTables: A Detailed Comparison Excel offers two powerful tools for data summarization and reorganization: the PIVOTBY function and PivotTables. Both group and aggregate data for detailed analysis, but their usage dif
 How to make a histogram in ExcelApr 22, 2025 am 10:33 AM
This tutorial explores three distinct methods for creating histograms in Excel: leveraging the Analysis ToolPak's Histogram tool, employing the FREQUENCY or COUNTIFS functions, and utilizing PivotCharts. While creating basic charts in Excel is strai
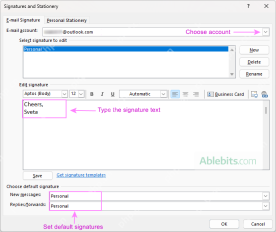 Outlook signature: how to make, add and changeApr 22, 2025 am 09:54 AM
This comprehensive guide provides step-by-step instructions for creating and managing professional email signatures in Microsoft Outlook. Learn how to craft compelling signatures with images, clickable links, and more, across all Outlook versions (i
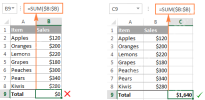 Excel SUM formula to total a column, rows or only visible cellsApr 22, 2025 am 09:17 AM
This tutorial demonstrates how to calculate sums in Excel using the AutoSum feature and custom SUM formulas for columns, rows, and selected ranges. It also covers summing only visible cells, calculating running totals, summing across multiple sheets
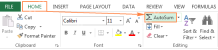 How to AutoSum in ExcelApr 22, 2025 am 09:05 AM
This concise guide explains Excel's AutoSum feature and its efficient uses. Learn to quickly sum columns, rows, or visible cells, and troubleshoot common AutoSum issues. Excel's SUM function is incredibly popular, prompting Microsoft to include a ded
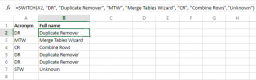 Excel Switch function – the compact form of nested IF statementApr 22, 2025 am 09:04 AM
This article introduces the Excel SWITCH function, explaining its syntax and demonstrating its use in simplifying complex nested IF statements. If you've struggled with lengthy nested IF formulas, the SWITCH function offers a significant time-saving
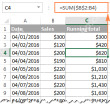 How to do a running total in Excel (Cumulative Sum formula)Apr 21, 2025 am 11:16 AM
This concise guide demonstrates how to efficiently calculate running totals (cumulative sums) in Excel using a SUM formula with strategically placed absolute and relative cell references. A running total displays the accumulated sum of a dataset as
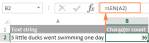 Excel LEN function: count characters in cellApr 21, 2025 am 10:10 AM
Are you looking for an Excel formula to count characters in a cell? If so, then you have certainly landed up on the right page. This short tutorial will teach you how you can use the LEN function to count characters in Excel, with or with


Hot AI Tools

Undresser.AI Undress
AI-powered app for creating realistic nude photos

AI Clothes Remover
Online AI tool for removing clothes from photos.

Undress AI Tool
Undress images for free

Clothoff.io
AI clothes remover

Video Face Swap
Swap faces in any video effortlessly with our completely free AI face swap tool!

Hot Article
Hot Tools

SAP NetWeaver Server Adapter for Eclipse
Integrate Eclipse with SAP NetWeaver application server.

VSCode Windows 64-bit Download
A free and powerful IDE editor launched by Microsoft

SecLists
SecLists is the ultimate security tester's companion. It is a collection of various types of lists that are frequently used during security assessments, all in one place. SecLists helps make security testing more efficient and productive by conveniently providing all the lists a security tester might need. List types include usernames, passwords, URLs, fuzzing payloads, sensitive data patterns, web shells, and more. The tester can simply pull this repository onto a new test machine and he will have access to every type of list he needs.

Notepad++7.3.1
Easy-to-use and free code editor

Safe Exam Browser
Safe Exam Browser is a secure browser environment for taking online exams securely. This software turns any computer into a secure workstation. It controls access to any utility and prevents students from using unauthorized resources.

