
 Software TutorialOffice SoftwareWhat are the differences between spss and excel_The difference between spss and excel
What are the differences between spss and excel_The difference between spss and excel

Faced with a large amount of data, are you hesitant and don’t know whether to choose SPSS or Excel? PHP editor Yuzai brings you a comprehensive comparison between SPSS and Excel to reveal their differences. This article will specifically explore their differences in data processing, statistical analysis, modeling, and visualization to help you make an informed choice based on your specific needs. Read on to learn more about the differences between SPSS and Excel and find the best tool for your project.
SPSS is a professional statistical software, and its routine is completely different from EXCEL. It is specifically reflected in the following places:
(1) There are many professional indicators, and there are few professional indicators in EXCEL. Of course, EXCEL also has some professional statistical functions, such as STDEV standard deviation function, which are everywhere in SPSS. .
(2) With the specialization of analysis methods, there are many statistical models. However, people who have used SPSS often say that SPSS has too many statistical models, which often makes me dizzy.
(3) Drawing is much more professional than EXCEL. The drawing itself has the flavor of analysis. For beginners, it is often through drawing that they experience the difference and power of SPSS.
To explain SPSS clearly, I have to write a book. Here is a simple example to illustrate the difference between professional statistical software and EXCEL:
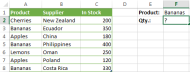
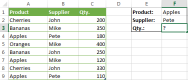
(1) There is the following EXCEL data

(2) We want to analyze some circumstances of the book purchase price, such as the impact of age, gender, education, recommendation channels, etc. on the book purchase price, through graphic representation.
(3) Use SPSS to read the EXCEL data in

(4) Draw a graph and use a scatter plot

( 5) Choose a simple scatter chart

(6) SPSS scatter chart can realize five-dimensional chart, which is 5 dimensions. EXCEL can only realize three-dimensional chart at most, which is the bubble chart. .

(7) Let’s see the effect

Let’s pull the wrench index, age, book price, gender, education, recommendation, yes Not 5 dimensions? What is drawn here is the famous panel diagram, plus a setting mark. If you look carefully at this picture, you can see that the distribution of book purchase prices is basically clear.
The above is the detailed content of What are the differences between spss and excel_The difference between spss and excel. For more information, please follow other related articles on the PHP Chinese website!

 How to use SUMIF function in Excel with formula examplesMay 13, 2025 am 10:53 AM
This tutorial explains the Excel SUMIF function in plain English. The main focus is on real-life formula examples with all kinds of criteria including text, numbers, dates, wildcards, blanks and non-blanks. Microsoft Excel has a handful o
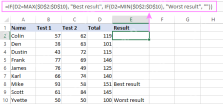
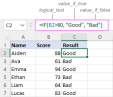 IF function in Excel: formula examples for text, numbers, dates, blanksMay 13, 2025 am 10:50 AM
In this article, you will learn how to build an Excel IF statement for different types of values as well as how to create multiple IF statements. IF is one of the most popular and useful functions in Excel. Generally, you use an IF statem
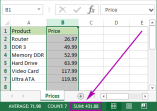 How to sum a column in Excel - 5 easy waysMay 13, 2025 am 09:53 AM
This tutorial shows how to sum a column in Excel 2010 - 2016. Try out 5 different ways to total columns: find the sum of the selected cells on the Status bar, use AutoSum in Excel to sum all or only filtered cells, employ the SUM function
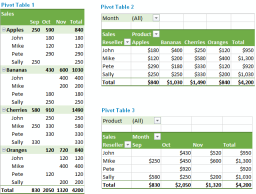 How to make and use Pivot Table in ExcelMay 13, 2025 am 09:36 AM
In this tutorial you will learn what a PivotTable is, find a number of examples showing how to create and use Pivot Tables in all version of Excel 365 through Excel 2007. If you are working with large data sets in Excel, Pivot Table comes
 Excel SUMIFS and SUMIF with multiple criteria – formula examplesMay 13, 2025 am 09:05 AM
This tutorial explains the difference between the SUMIF and SUMIFS functions in terms of their syntax and usage, and provides a number of formula examples to sum values with multiple AND / OR criteria in Excel 365, 2021, 2019, 2016, 2013,
 How You Can Use Wildcards in Microsoft Excel to Refine Your SearchMay 13, 2025 am 01:59 AM
Excel wildcards: a powerful tool for efficient search and filtering This article will dive into the power of wildcards in Microsoft Excel, including their application in search, formulas, and filters, and some details to note. Wildcards allow you to perform fuzzy matching, making it more flexible to find and process data. *Wildcards: asterisks () and question marks (?)** Excel mainly uses two wildcards: asterisk (*) and question mark (?). *Asterisk (): Any number of characters** The asterisk represents any number of characters, including zero characters. For example: *OK* Match the cell containing "OK", "OK&q
 Excel IF function with multiple conditionsMay 12, 2025 am 11:02 AM
The tutorial shows how to create multiple IF statements in Excel with AND as well as OR logic. Also, you will learn how to use IF together with other Excel functions. In the first part of our Excel IF tutorial, we looked at how to constru
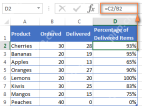 How to calculate percentage in Excel - formula examplesMay 12, 2025 am 10:28 AM
In this tutorial, you will lean a quick way to calculate percentages in Excel, find the basic percentage formula and a few more formulas for calculating percentage increase, percent of total and more. Calculating percentage is useful in m


Hot AI Tools

Undresser.AI Undress
AI-powered app for creating realistic nude photos

AI Clothes Remover
Online AI tool for removing clothes from photos.

Undress AI Tool
Undress images for free

Clothoff.io
AI clothes remover

Video Face Swap
Swap faces in any video effortlessly with our completely free AI face swap tool!

Hot Article
Hot Tools

SublimeText3 English version
Recommended: Win version, supports code prompts!

EditPlus Chinese cracked version
Small size, syntax highlighting, does not support code prompt function

VSCode Windows 64-bit Download
A free and powerful IDE editor launched by Microsoft

Dreamweaver Mac version
Visual web development tools

Atom editor mac version download
The most popular open source editor

