Home >Software Tutorial >Office Software >How to use excel to make a line chart_How to use excel to make a line chart
How to use excel to make a line chart_How to use excel to make a line chart
- 王林Original
- 2024-06-04 13:17:02781browse
Drawing a line chart in Excel is a powerful tool for visualizing data trends. PHP editor Xiaoxin will introduce in detail the steps to make a line chart using Excel, including: Organize data to fit the line chart Use the Chart Wizard to easily create a line chart Customize the line chart to enhance visual effects By following these concise steps, you can easily master Draw clear, informative line graphs to effectively communicate data.
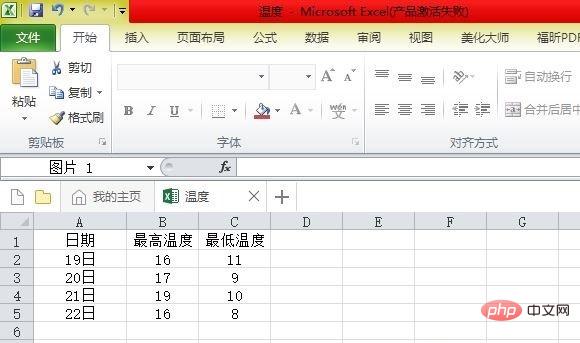
Step one: First open the form we need to create.
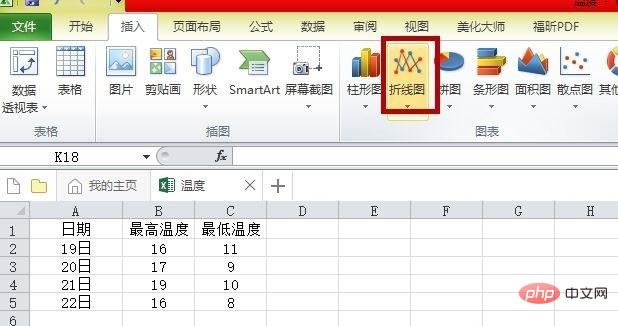
Step 2: Then click Insert and select the line chart.
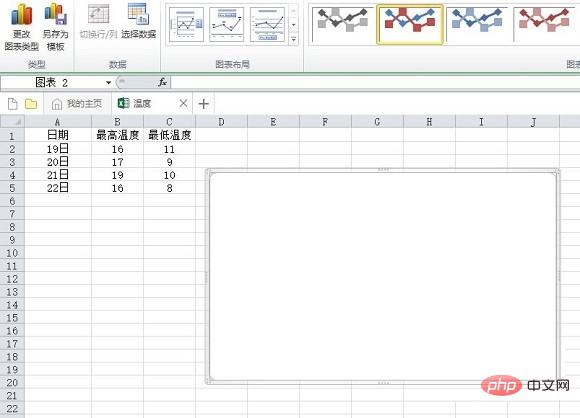
Step 3: Then select the data to be charted and click Copy.
Step 4: Paste on the chart.
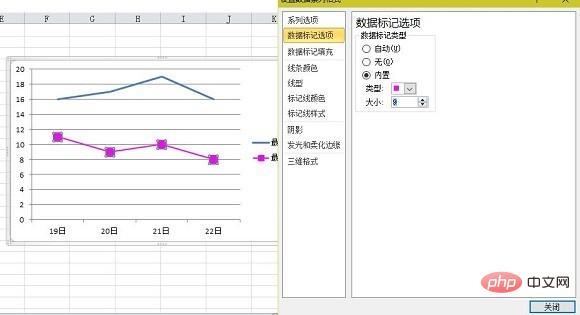
Step 5: Double-click the polyline, and a prompt box will pop up to change the format.
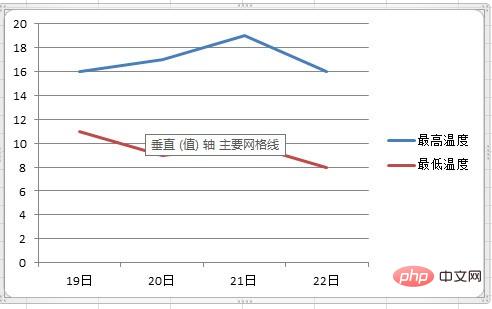
Step 6: The final result is displayed.
The above is the detailed content of How to use excel to make a line chart_How to use excel to make a line chart. For more information, please follow other related articles on the PHP Chinese website!

