


Matplotlib是一个Python 2D绘图库,它可以在各种平台上以各种硬拷贝格式和交互式环境生成出具有出版品质的图形。

在上篇 Matplotlib 数据可视化教程中,我们要介绍如何创建堆叠图和饼图。今天给大家带来是针对于图形颜色和线条的填充。
颜色
我们要做的第一个改动是将plt.title更改为stock变量。
plt.title(stock)
现在,让我们来介绍一下如何更改标签颜色。 我们可以通过修改我们的轴对象来实现:
ax1.xaxis.label.set_color('c')
ax1.yaxis.label.set_color('r')
如果我们运行它,我们会看到标签改变了颜色,就像在单词中那样。
接下来,我们可以为要显示的轴指定具体数字,而不是像这样的自动选择:
ax1.set_yticks([0,25,50,75])
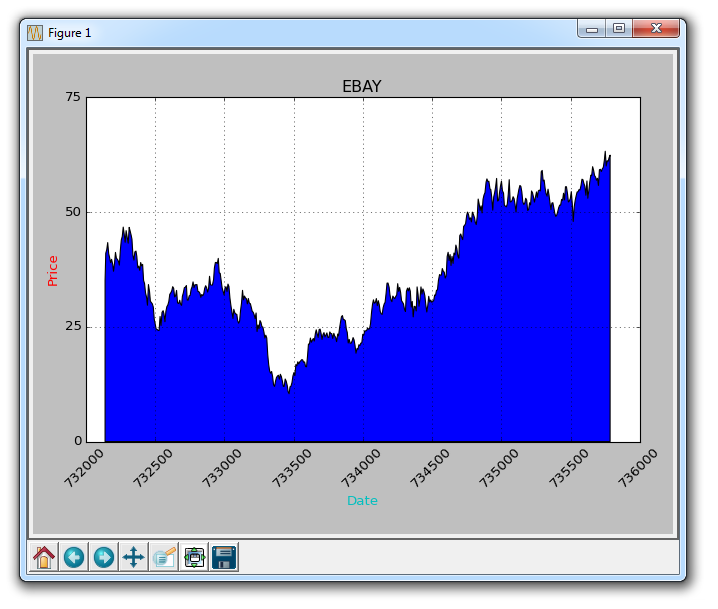
接下来,我想介绍填充。 填充所做的事情,是在变量和你选择的一个数值之间填充颜色。 例如,我们可以这样:
ax1.fill_between(date, 0, closep)
所以到这里,我们的代码为:
import matplotlib.pyplot as plt
import numpy as np
import urllib
import datetime as dt
import matplotlib.dates as mdates

def bytespdate2num(fmt, encoding='utf-8'):
    strconverter = mdates.strpdate2num(fmt)
    def bytesconverter(b):
        s = b.decode(encoding)
        return strconverter(s)
    return bytesconverter


def graph_data(stock):

    fig = plt.figure()
    ax1 = plt.subplot2grid((1,1), (0,0))

    stock_price_url = 'http://chartapi.finance.yahoo.com/instrument/1.0/'+stock+'/chartdata;type=quote;range=10y/csv'
    source_code = urllib.request.urlopen(stock_price_url).read().decode()
    stock_data = []
    split_source = source_code.split('\n')
    for line in split_source:
        split_line = line.split(',')
        if len(split_line) == 6:
            if 'values' not in line and 'labels' not in line:
                stock_data.append(line)


    date, closep, highp, lowp, openp, volume = np.loadtxt(stock_data,
                                                          delimiter=',',
                                                          unpack=True,
                                                          converters={0: bytespdate2num('%Y%m%d')})

    ax1.fill_between(date, 0, closep)

    for label in ax1.xaxis.get_ticklabels():
        label.set_rotation(45)
    ax1.grid(True)#, color='g', linestyle='-', linewidth=5)
    ax1.xaxis.label.set_color('c')
    ax1.yaxis.label.set_color('r')
    ax1.set_yticks([0,25,50,75])

    plt.xlabel('Date')
    plt.ylabel('Price')
    plt.title(stock)
    plt.legend()
    plt.subplots_adjust(left=0.09, bottom=0.20, right=0.94, top=0.90, wspace=0.2, hspace=0)
    plt.show()


graph_data('EBAY')
结果为:
填充的一个问题是,我们可能最后会把东西都覆盖起来。 我们可以用透明度来解决它:
ax1.fill_between(date, 0, closep)
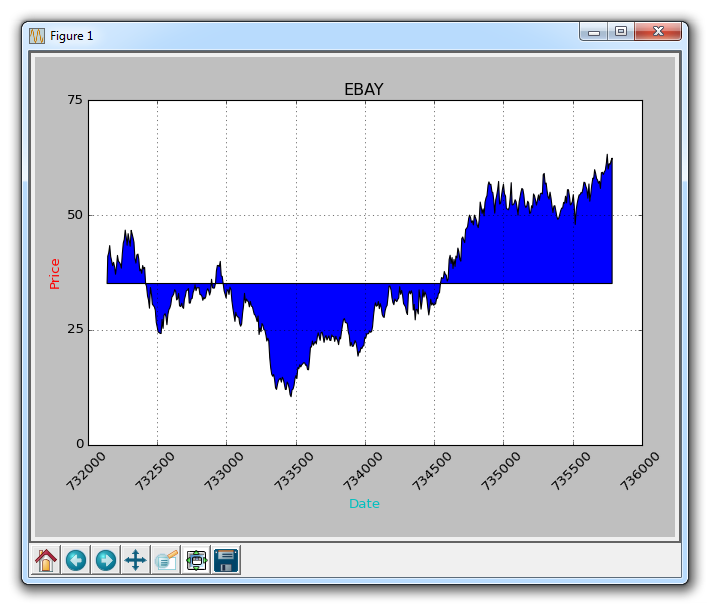
现在,让我们介绍条件填充。 让我们假设图表的起始位置是我们开始买入 eBay 的地方。 这里,如果价格低于这个价格,我们可以向上填充到原来的价格,然后如果它超过了原始价格,我们可以向下填充。 我们可以这样做:
ax1.fill_between(date, closep[0], closep)
会生成:
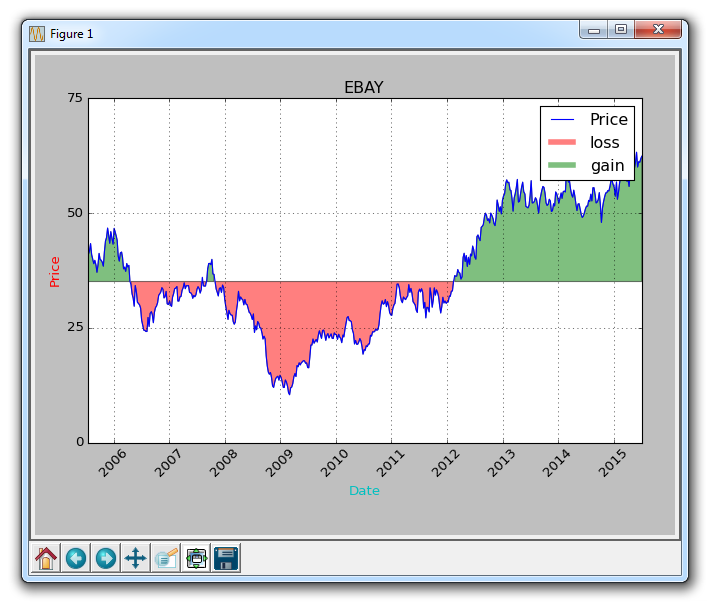
如果我们想用红色和绿色填充来展示收益/损失,那么与原始价格相比,绿色填充用于上升(注:国外股市的颜色和国内相反),红色填充用于下跌? 没问题! 我们可以添加一个where参数,如下所示:
ax1.fill_between(date, closep, closep[0],where=(closep > closep[0]), facecolor='g', alpha=0.5)
这里,我们填充当前价格和原始价格之间的区域,其中当前价格高于原始价格。 我们给予它绿色的前景色,因为这是一个上升,而且我们使用微小的透明度。
线条
我们仍然不能对多边形数据(如填充)应用标签,但我们可以像以前一样实现空线条,因此我们可以:
ax1.plot([],[],linewidth=5, label='loss', color='r',alpha=0.5)
ax1.plot([],[],linewidth=5, label='gain', color='g',alpha=0.5)
ax1.fill_between(date, closep, closep[0],where=(closep > closep[0]), facecolor='g', alpha=0.5)
ax1.fill_between(date, closep, closep[0],where=(closep < closep[0]), facecolor='r', alpha=0.5)
这向我们提供了一些填充,以及用于处理标签的空线条,我们打算将其显示在图例中。这里完整的代码是:
import matplotlib.pyplot as plt
import numpy as npimport urllib
import datetime as dt
import matplotlib.dates as mdates

def bytespdate2num(fmt, encoding='utf-8'):
    strconverter = mdates.strpdate2num(fmt)
    def bytesconverter(b):
        s = b.decode(encoding)
        return strconverter(s)

    return bytesconverter
def graph_data(stock):

    fig = plt.figure()
    ax1 = plt.subplot2grid((1,1), (0,0))

    stock_price_url = 'http://chartapi.finance.yahoo.com/instrument/1.0/'+stock+'/chartdata;type=quote;range=10y/csv'
    source_code = urllib.request.urlopen(stock_price_url).read().decode()
    stock_data = []
    split_source = source_code.split('\n')
    for line in split_source:
        split_line = line.split(',')
       if len(split_line) == 6:
           if 'values' not in line and 'labels' not in line:
              stock_data.append(line)
    date, closep, highp, lowp, openp, volume = np.loadtxt(stock_data,
                                        delimiter=',',
                                        unpack=True,
                                        converters={0: bytespdate2num('%Y%m%d')})
    ax1.plot_date(date, closep,'-', label='Price')
    ax1.plot([],[],linewidth=5, label='loss', color='r',alpha=0.5)
    ax1.plot([],[],linewidth=5, label='gain', color='g',alpha=0.5)
    ax1.fill_between(date, closep, closep[0],where=(closep > closep[0]), facecolor='g', alpha=0.5)
    ax1.fill_between(date, closep, closep[0],where=(closep < closep[0]), facecolor='r', alpha=0.5)
    for label in ax1.xaxis.get_ticklabels():
       label.set_rotation(45)
    ax1.grid(True)#, color='g', linestyle='-', linewidth=5)
    ax1.xaxis.label.set_color('c')
    ax1.yaxis.label.set_color('r')
    ax1.set_yticks([0,25,50,75])

    plt.xlabel('Date')
    plt.ylabel('Price')
    plt.title(stock)
    plt.legend()
    plt.subplots_adjust(left=0.09, bottom=0.20, right=0.94, top=0.90, wspace=0.2, hspace=0)
    plt.show()
graph_data('EBAY')
现在我们的结果是:
以上是Matplotlib中对图形颜色和线条的填充的详细内容。更多信息请关注PHP中文网其他相关文章!

 为什么数组通常比存储数值数据列表更高?May 05, 2025 am 12:15 AM
ArraySareAryallyMoremory-Moremory-forigationDataDatueTotheIrfixed-SizenatureAntatureAntatureAndirectMemoryAccess.1)arraysStorelelementsInAcontiguxufulock,ReducingOveringOverheadHeadefromenterSormetormetAdata.2)列表,通常
 如何将Python列表转换为Python阵列?May 05, 2025 am 12:10 AM
ToconvertaPythonlisttoanarray,usethearraymodule:1)Importthearraymodule,2)Createalist,3)Usearray(typecode,list)toconvertit,specifyingthetypecodelike'i'forintegers.Thisconversionoptimizesmemoryusageforhomogeneousdata,enhancingperformanceinnumericalcomp
 您可以将不同的数据类型存储在同一Python列表中吗?举一个例子。May 05, 2025 am 12:10 AM
Python列表可以存储不同类型的数据。示例列表包含整数、字符串、浮点数、布尔值、嵌套列表和字典。列表的灵活性在数据处理和原型设计中很有价值,但需谨慎使用以确保代码的可读性和可维护性。
 Python中的数组和列表之间有什么区别?May 05, 2025 am 12:06 AM
Pythondoesnothavebuilt-inarrays;usethearraymoduleformemory-efficienthomogeneousdatastorage,whilelistsareversatileformixeddatatypes.Arraysareefficientforlargedatasetsofthesametype,whereaslistsofferflexibilityandareeasiertouseformixedorsmallerdatasets.
 通常使用哪种模块在Python中创建数组?May 05, 2025 am 12:02 AM
theSostCommonlyusedModuleForCreatingArraysInpyThonisnumpy.1)NumpyProvidEseffitedToolsForarrayOperations,Idealfornumericaldata.2)arraysCanbeCreatedDusingsnp.Array()for1dand2Structures.3)
 您如何将元素附加到Python列表中?May 04, 2025 am 12:17 AM
toAppendElementStoApythonList,usetheappend()方法forsingleements,Extend()formultiplelements,andinsert()forspecificpositions.1)useeAppend()foraddingoneOnelementAttheend.2)useextendTheEnd.2)useextendexendExendEnd(
 您如何创建Python列表?举一个例子。May 04, 2025 am 12:16 AM
TocreateaPythonlist,usesquarebrackets[]andseparateitemswithcommas.1)Listsaredynamicandcanholdmixeddatatypes.2)Useappend(),remove(),andslicingformanipulation.3)Listcomprehensionsareefficientforcreatinglists.4)Becautiouswithlistreferences;usecopy()orsl
 讨论有效存储和数值数据的处理至关重要的实际用例。May 04, 2025 am 12:11 AM
金融、科研、医疗和AI等领域中,高效存储和处理数值数据至关重要。 1)在金融中,使用内存映射文件和NumPy库可显着提升数据处理速度。 2)科研领域,HDF5文件优化数据存储和检索。 3)医疗中,数据库优化技术如索引和分区提高数据查询性能。 4)AI中,数据分片和分布式训练加速模型训练。通过选择适当的工具和技术,并权衡存储与处理速度之间的trade-off,可以显着提升系统性能和可扩展性。


热AI工具

Undresser.AI Undress
人工智能驱动的应用程序,用于创建逼真的裸体照片

AI Clothes Remover
用于从照片中去除衣服的在线人工智能工具。

Undress AI Tool
免费脱衣服图片

Clothoff.io
AI脱衣机

Video Face Swap
使用我们完全免费的人工智能换脸工具轻松在任何视频中换脸!

热门文章
热工具

SublimeText3汉化版
中文版,非常好用

记事本++7.3.1
好用且免费的代码编辑器

禅工作室 13.0.1
功能强大的PHP集成开发环境

PhpStorm Mac 版本
最新(2018.2.1 )专业的PHP集成开发工具

SecLists
SecLists是最终安全测试人员的伙伴。它是一个包含各种类型列表的集合,这些列表在安全评估过程中经常使用,都在一个地方。SecLists通过方便地提供安全测试人员可能需要的所有列表,帮助提高安全测试的效率和生产力。列表类型包括用户名、密码、URL、模糊测试有效载荷、敏感数据模式、Web shell等等。测试人员只需将此存储库拉到新的测试机上,他就可以访问到所需的每种类型的列表。

