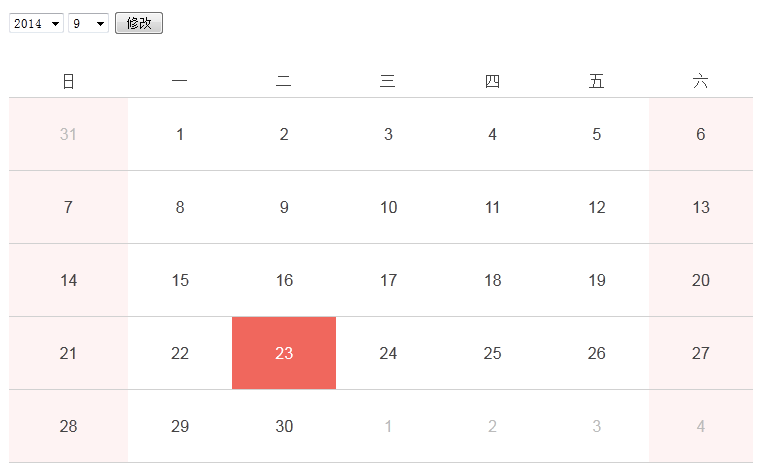
PHP開發之製作簡單日曆設定table中的tr與td

設定draw方法,畫表格,設定table中的tr與td
1)資料將會用table標籤來顯示,所以這裡要將各個tr下面的td排列好
2)$index % 7 == 0 計算表格每行的第一列
3)$index % 7 == 6 || $index == ($length -1) 計算每行的最後一列,或$caculate的最後一個資料
4)將中間行加入$tr中,就是每一行的array
<?php
function draw($caculate) {  //$caculate 通过caculate方法计算后的数据
      $tr = array();
      $length = count($caculate);
      $result = array();
      foreach ($caculate as $index => $date) {
         if($index % 7 == 0) {//第一列
            $tr = array($date);
         }elseif($index % 7 == 6 || $index == ($length-1)) {
            array_push($tr, $date);
            array_push($result, $tr);//添加到返回的数据中
            $tr = array();//清空数组列表
         }else {
            array_push($tr, $date);
         }
      }
      return $result;
   }

?><?php
function draw($caculate) { //$caculate 通过caculate方法计算后的数据
$tr = array();
$length = count($caculate);
$result = array();
foreach ($caculate as $index => $date) {
if($index % 7 == 0) {//第一列
$tr = array($date);
}elseif($index % 7 == 6 || $index == ($length-1)) {
array_push($tr, $date);
array_push($result, $tr);//添加到返回的数据中
$tr = array();//清空数组列表
}else {
array_push($tr, $date);
}
}
return $result;
}
?>
