Vue3 echart를 구성 요소화하고 크기 조정을 위해 후크를 사용하는 방법은 무엇입니까?
- 王林앞으로
- 2023-05-23 13:34:421727검색
후크를 사용하여 차트 구성 요소화 및 크기 조정
후크는 기본적으로 설정 함수에 사용되는 구성 API를 캡슐화하는 기능입니다

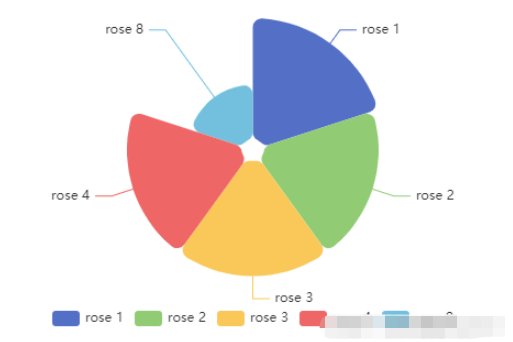
구성 요소화된 echarts 인스턴스
<template>
  <div ref="echart" :></div>
</template>

<script setup>
import * as echarts from "echarts";
import useResize from "@/hooks/useResize"; // hook 代码见下方

const { proxy } = getCurrentInstance(); // 获取实例中的proxy

let echart;
let echartInstance;

const props = defineProps({
  // 数据
  data: {
    type: Array,
    default: [
      { value: 40, name: "rose 1" },
      { value: 38, name: "rose 2" },
      { value: 32, name: "rose 3" },
    ],
  },
  // 高度
  height: {
    type: [Number, String],
    default: "300px",
  },
  // 宽度
  width: {
    type: [Number, String],
    default: "100%",
  },
});

const { data } = toRefs(props);

const data1 = reactive({
  option: {
    legend: {
      top: "bottom",
    },
    toolbox: {
      show: false,
      feature: {
        mark: { show: true },
        dataView: { show: true, readOnly: false },
        restore: { show: true },
        saveAsImage: { show: true },
      },
    },
    tooltip: {
      trigger: "item",
      formatter: "{b} : {c} ({d}%)",
    },
    series: [
      {
        name: "Nightingale Chart",
        type: "pie",
        radius: [10, 120],
        center: ["50%", "45%"],
        roseType: "area",
        itemStyle: {
          borderRadius: 8,
        },
        data: data.value,
      },
    ],
  },
});

const { option } = toRefs(data1);

// 观察 data ,重新绘制
watch(
  data,
  (newValue) => {
    option.value.series[0].data = newValue;
  },
  { deep: true }
);
watch(
  option,
  (newValue) => {
    echartInstance.setOption(newValue, true);
  },
  { deep: true }
);

onMounted(() => {
  echart = proxy.$refs.echart; // 获取的DOM根节点
  echartInstance = echarts.init(echart, "macarons"); // 初始化 echart
  echartInstance.setOption(option.value, true); // 绘制
  // notMerge 可选。是否不跟之前设置的 option 进行合并。默认为 false。即表示合并。合并的规则,详见 组件合并模式。如果为 true,表示所有组件都会被删除,然后根据新 option 创建所有新组件。
  // setOption 见 https://echarts.apache.org/zh/api.html#echartsInstance.setOption
});

function resize() {
  echartInstance.resize();
}

// 暴露函数 (供hook调用)
defineExpose({
  resize,
});

useResize();
</script>
hook(useResize)
export default function () {
    let proxy

    onMounted(() => {
        proxy = getCurrentInstance(); // 获取实例中的proxy
        window.addEventListener('resize', resize)
    })

    onBeforeUnmount(() => {
        window.removeEventListener('resize', resize)
    })

    function resize() {
        proxy.exposed.resize()
    }
}
echarts 사용 및 전자 차트 Adaptive
echarts를 먼저 설치해 보세요. 이건 소개는 하지 않고 사용법만 얘기하겠습니다.
<!-- 创建一个div去显示echarts -->
<div ref="main" ></div>
import {ref, provide, inject, onMounted, reactive} from "vue";
import * as echarts from "echarts";
const main = ref() // 使用ref创建虚拟DOM引用,使用时用main.value
onMounted(
    () => {
        init()
    }
)
function init() {
    // 基于准备好的dom,初始化echarts实例
    var myChart = echarts.init(main.value);
    // 指定图表的配置项和数据
    var option = {
        /*title: {
            text: 'ECharts 入门示例'
        },*/
        tooltip: {},
        // color:['#779ffe','#a07dfe','#fc9b2e','#63f949','#fb6464','#fce481'],
        /*grid: {
            left: '30%',
            right: '4%',
            bottom: '3%',
            containLabel: true
        },*/
        legend: {
            // data: ['国家类型','非国家类型','个人','法人','可公式','非公式']
        },
        xAxis: {
            type: 'category',
            data: ['国家类型','非国家类型','个人','法人','可公式','非公式']
        },
        yAxis: {
            type: 'value',
            scale: true,
            max: 150,
            min: 0,
            splitNumber: 3,
        },
        series: [
            {
                data: [
                    {
                        value: 120,
                        itemStyle: {
                            color: '#7fa6fe'
                        }
                    },
                    {
                        value: 90,
                        itemStyle: {
                            color: '#a17fff'
                        }
                    },
                    {
                        value: 40,
                        itemStyle: {
                            color: '#fda630'
                        }
                    },
                    {
                        value: 120,
                        itemStyle: {
                            color: '#93fc73'
                        }
                    },
                    {
                        value: 120,
                        itemStyle: {
                            color: '#fb6666'
                        }
                    },
                    {
                        value: 120,
                        itemStyle: {
                            color: '#fbe068'
                        }
                    }
                ],
                type: 'bar'
            }
        ]
    };
    // 使用刚指定的配置项和数据显示图表。
    myChart.setOption(option);
}
위 내용은 Vue3 echart를 구성 요소화하고 크기 조정을 위해 후크를 사용하는 방법은 무엇입니까?의 상세 내용입니다. 자세한 내용은 PHP 중국어 웹사이트의 기타 관련 기사를 참조하세요!
성명:
이 기사는 yisu.com에서 복제됩니다. 침해가 있는 경우 admin@php.cn으로 문의하시기 바랍니다. 삭제

