ホームページ >ウェブフロントエンド >Vue.js >vue.js は echart を使用できますか?
vue.js は echart を使用できますか?
- 青灯夜游オリジナル
- 2020-12-21 11:43:532221ブラウズ
vue.js は echarts を使用できます。具体的な操作方法: 1. コンソールで「npm install echarts --save」コマンドを入力して echarts の依存関係をインストールします; 2. main.js にグローバルにインポートし、 echarts はグラフを作成します。

このチュートリアルの動作環境: Windows7 システム、vue2.9 バージョン。この方法はすべてのブランドのコンピューターに適しています。
関連する推奨事項:「vue.js チュートリアル 」
プロジェクトは vue-cli を使用して開発されているため、最近の作業で echarts を使用する必要があります。インターネット上で vue で合成された vue-echart を見つけましたが、vue で指定されたデータ形式を使用したくなかったので、ネイティブ echart を参照する vue プロジェクトの簡単なデモを作成しました。メソッドが使用されます
準備
1. echarts の依存関係をインストールします
コンソール入力: npm install echarts --save
2. グローバルの紹介
main.jsへの導入
import echarts from 'echarts'
Vue.prototype.$echarts = echarts
チャートの作成
最初の作成方法
複数のチャートを .vue ファイルに導入します
Create WelcomePage.vue
<template>
 <div>
 <h1>第一种在vue中使用echart的方式</h1>

 <div class="charts">
  <div id="barGraph" style="height: 350px;"></div>
 </div>

 <div class="charts">
  <div id="pieGraph" style="height: 350px;"></div>
 </div>

 </div>
</template>
<script>
// 引入基本模板,按需加载
let echarts = require('echarts/lib/echarts');
// 引入柱状图
require('echarts/lib/chart/bar');
// 引入柱状图
require('echarts/lib/chart/pie');
require('echarts/lib/component/tooltip');
require('echarts/lib/component/title');
export default {
name: "WelcomePage",
data () {
return { }
},
mounted(){
this.drawBar();
this.drawPie();
},
methods:{
drawBar(){
// 基于dom,初始化echarts实例
let barGraph = echarts.init(document.getElementById('barGraph'));
// 绘制图表
barGraph.setOption({
title: {
text: '全年产量趋势图',
left: 'center'
},
tooltip: {
trigger: 'item',
formatter: '{a} <br/>{b} : {c}'
},
legend: {
left: 'center',
data: ['本年', '上年'],
bottom:0
},
xAxis: {
type: 'category',
name: 'x',
splitLine: {show: false},
data: ['一月', '二月', '三月', '四月', '五月', '六月', '七月', '八月', '九月', '十月', '十一月', '十二月']
},
grid: {
left: '1%',
right: '2%',
bottom: '8%',
containLabel: true
},
yAxis: {
type: 'category',
name: 'y',
splitLine: {show: true},
data:['10%','20%','30%','40%','50%','60%','70%','80%','90%','100%']
},
series: [
{
name: '本年',
type: 'line',
data: [0.8, 0.98, 0.96, 0.27, 0.81, 0.47, 0.74, 0.23, .69, 0.25, 0.36, 0.56]
},
{
name: '上年',
type: 'line',
data: [1, 0.2, 0.4, 0.8, 0.16, 0.32, 0.64, 1.28, 5.6, 0.25, 0.63, 0.65, 0.12]
},
]
})
},
drawPie(){
let pieGraph = echarts.init(document.getElementById('pieGraph'));
pieGraph.setOption({
title : {
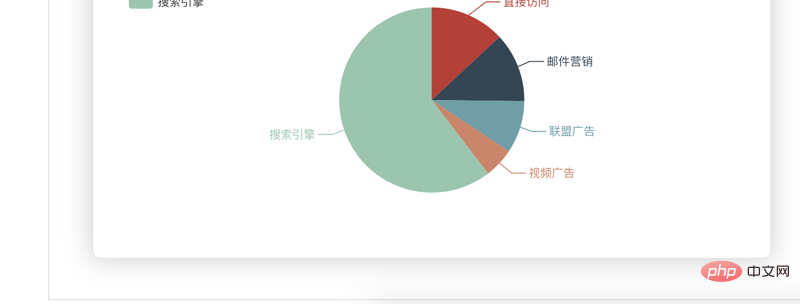
text: '某站点用户访问来源',
subtext: '纯属虚构',
x:'center'
},
tooltip : {
trigger: 'item',
formatter: "{a} <br/>{b} : {c} ({d}%)"
},
legend: {
orient: 'vertical',
left: 'left',
data: ['直接访问','邮件营销','联盟广告','视频广告','搜索引擎']
},
series : [
{
name: '访问来源',
type: 'pie',
radius : '55%',
center: ['50%', '60%'],
data:[
{value:335, name:'直接访问'},
{value:310, name:'邮件营销'},
{value:234, name:'联盟广告'},
{value:135, name:'视频广告'},
{value:1548, name:'搜索引擎'}
],
itemStyle: {
emphasis: {
shadowBlur: 10,
shadowOffsetX: 0,
shadowColor: 'rgba(0, 0, 0, 0.5)'
}
}
}
]
})
}
}
}
</script>効果は以下のようになります:

2 番目の実装方法 (コンポーネントの形式)
親コンポーネントの作成 Father.vue
<div>
 <h1>{{ msg }}</h1>
 <p>第二种方式:通过组件的方式进行页面渲染</p>
 <div class="container" >
  <bar-graph></bar-graph>
 </div>

 <div class="container">
  <pie-graph></pie-graph>
 </div>

 </div>
<script>
// 引入两个子组件
import BarGraph from "./bargraph";
import PieGraph from "./piegraph";
export default {
name: "father",
components:{
BarGraph,
PieGraph,
},
data(){
return{
msg: '我是爸爸,想看我的儿子,眼睛请往下移',
}
}
}
</script>サブコンポーネントの作成 barGraph.vue
 <div>
 <p>{{ msg }}</p>
 <div class="charts">
  <div :id="id" style="min-height: 350px;"></div>
 </div>
 </div>
<script>
let echarts = require('echarts/lib/echarts');
// 引入柱状图
require('echarts/lib/chart/bar');
require('echarts/lib/component/tooltip');
require('echarts/lib/component/title');
// import echarts from 'echarts'
export default {
name: "bargraph",
// props:['id'], // 第一种接收父亲传过来的值的方式
props: {
id: {
type: String,
default: 'chart'
}
},
data(){
return {
msg: "我是第一个子组件--bar",
chart: null,
}
},
mounted(){
this.drawBar();
},
methods:{
drawBar(){
this.chart = echarts.init(document.getElementById(this.id));
let colors = ['#5793f3', '#d14a61', '#675bba'];
this.chart.setOption(
{
color: colors,
tooltip: {
trigger: 'axis',
axisPointer: {
type: 'cross'
}
},
grid: {
right: '20%'
},
toolbox: {
feature: {
dataView: {show: true, readOnly: false},
restore: {show: true},
saveAsImage: {show: true}
}
},
legend: {
data:['蒸发量','降水量','平均温度']
},
xAxis: [
{
type: 'category',
axisTick: {
alignWithLabel: true
},
data: ['1月','2月','3月','4月','5月','6月','7月','8月','9月','10月','11月','12月']
}
],
yAxis: [
{
type: 'value',
name: '蒸发量',
min: 0,
max: 250,
position: 'right',
axisLine: {
lineStyle: {
color: colors[0]
}
},
axisLabel: {
formatter: '{value} ml'
}
},
{
type: 'value',
name: '降水量',
min: 0,
max: 250,
position: 'right',
offset: 80,
axisLine: {
lineStyle: {
color: colors[1]
}
},
axisLabel: {
formatter: '{value} ml'
}
},
{
type: 'value',
name: '温度',
min: 0,
max: 25,
position: 'left',
axisLine: {
lineStyle: {
color: colors[2]
}
},
axisLabel: {
formatter: '{value} °C'
}
}
],
series: [
{
name:'蒸发量',
type:'bar',
data:[2.0, 4.9, 7.0, 23.2, 25.6, 76.7, 135.6, 162.2, 32.6, 20.0, 6.4, 3.3]
},
{
name:'降水量',
type:'bar',
yAxisIndex: 1,
data:[2.6, 5.9, 9.0, 26.4, 28.7, 70.7, 175.6, 182.2, 48.7, 18.8, 6.0, 2.3]
},
{
name:'平均温度',
type:'line',
yAxisIndex: 2,
data:[2.0, 2.2, 3.3, 4.5, 6.3, 10.2, 20.3, 23.4, 23.0, 16.5, 12.0, 6.2]
}
]
}
)
}
}
}
</script>Create pieGraph.vue
<template>
 <div>
  <p>{{ msg }}</p>

  <div class="charts">
  <div :id="id" style="min-height: 350px;"></div>
  </div>
 </div>
</template>
<script>
import echarts from 'echarts'
export default {
name: "piegraph",
props:{
id: {
type: String,
default: 'pieChart'
}
},
data(){
return{
msg: '我是第二个子组件--pie',
pieChart: null
}
},
mounted(){
this.drawPie();
},
methods: {
drawPie () {
this.pieChart = echarts.init(document.getElementById(this.id));
this.pieChart.setOption(
{
title : {
text: '某站点用户访问来源',
subtext: '纯属虚构',
x:'center'
},
tooltip : {
trigger: 'item',
formatter: "{a} <br/>{b} : {c} ({d}%)"
},
legend: {
orient: 'vertical',
left: 'left',
data: ['直接访问','邮件营销','联盟广告','视频广告','搜索引擎']
},
series : [
{
name: '访问来源',
type: 'pie',
radius : '55%',
center: ['50%', '60%'],
data:[
{value:335, name:'直接访问'},
{value:310, name:'邮件营销'},
{value:234, name:'联盟广告'},
{value:135, name:'视频广告'},
{value:1548, name:'搜索引擎'}
],
itemStyle: {
emphasis: {
shadowBlur: 10,
shadowOffsetX: 0,
shadowColor: 'rgba(0, 0, 0, 0.5)'
}
}
}
]
}
)
}
}
}
</script> 効果 実装は次のとおりです:


ルーティング ファイルは次のとおりです:
import WelcomePage from '@/components/WelcomePage'
import Father from '@/components/father'

import BarGraph from '@/components/bargraph'
import PieGraph from '@/components/piegraph'

export default new Router({
 routes: [
 {
  path: '/',
  name: 'WelcomePage',
  component: WelcomePage
 },
 {
  path: '/father',
  name: 'father',
  component: Father,
  children:[
  {
   path: '/bargraph',
   name: 'bargraph',
   component: BarGraph
  },
  {
   path: '/piegraph',
   name: 'piegraph',
   component: PieGraph
  }
  ]
 },
 ]
})
詳細プログラミング関連の知識については、 プログラミング教育 をご覧ください。 !
以上がvue.js は echart を使用できますか?の詳細内容です。詳細については、PHP 中国語 Web サイトの他の関連記事を参照してください。

