


php editor Apple introduces you a convenient and fast method that can help you easily intercept text content in Excel. In Excel, we often need to intercept part of the content in a cell for further processing or analysis. By using some functions and techniques provided by Excel, we can easily achieve this goal. Next, let us learn how to use this method to improve our work efficiency!
1. Select the cell or cell range where you want to perform the text interception operation, as shown in the figure, switch to the [Square Grid] tab.

2. In the [Square Grid] tab interface, click the [Intercept Text] drop-down list in the [Advanced Text Processing] column and select the [Intercept End Text] item.

3. When the [Tip End Text] window pops up, enter the number of characters to be intercepted and click the [OK] button to intercept the specified characters from the end of the text.

4. The effect after executing the [Intercept end text] command is as shown in the figure. It can be seen that this function is similar to the function of the Right function.

5. In addition, you can also perform the [Intercept the beginning text] or [Intercept the middle text] operation. As shown in the figure, select the cell area to be operated and click the [Capture middle text] button.

6. Finally, from the pop-up [Intercept Intermediate Text] window, set the [Start] and [End] parameters, and click [OK] to intercept the intermediate text.

7. The effect after executing the above command:

The above is the detailed content of How to intercept text content in Excel. For more information, please follow other related articles on the PHP Chinese website!

 Excel WEEKNUM function – convert week number to date and vice versaMay 09, 2025 am 11:11 AM
Excel's WEEKNUM function: Your guide to week number calculations While Excel offers numerous functions for dates, the WEEKNUM function stands alone for week number calculations. This tutorial explores its syntax, arguments, and practical applications
 Excel MONTH function - month name from date, last day of month, etc.May 09, 2025 am 10:59 AM
This tutorial delves into the intricacies of Excel's MONTH and EOMONTH functions. Through numerous formula examples, you'll learn to extract month information from dates, determine the first and last days of any month, convert between month names an
 WEEKDAY formula in Excel to get day of week, weekends and workdaysMay 09, 2025 am 10:25 AM
If you are looking for an Excel function to get day of week from date, you've landed on the right page. This tutorial will teach you how to use the WEEKDAY formula in Excel to convert a date to a weekday name, filter, highlight and count
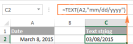 Convert date to text in Excel - TEXT function and no-formula waysMay 09, 2025 am 10:11 AM
This article explores several methods for converting Excel dates into text strings, offering both formula-based and non-formula solutions. Traditionally, we start with a formula solution and then explore a couple of non-formula alternatives. Using
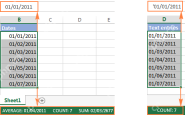 Excel: convert text to date and number to dateMay 09, 2025 am 09:36 AM
This tutorial demonstrates various Excel techniques for converting text and numbers into dates, including both formula-based and non-formula methods. You'll learn to efficiently transform text strings into usable date formats. Often, dates imported
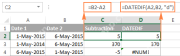 How to add and subtract dates in ExcelMay 08, 2025 am 11:36 AM
In this tutorial, you will find a variety of useful formulas to add and subtract dates in Excel, such as subtracting two dates, adding days, weeks, months and years to a date, and more. If you have been following our tutorials to working
 Excel WORKDAY and NETWORKDAYS functions to calculate working daysMay 08, 2025 am 10:49 AM
This tutorial demonstrates how to use Excel's WORKDAY, WORKDAY.INTL, NETWORKDAYS, and NETWORKDAYS.INTL functions to efficiently calculate weekdays, considering custom weekend settings and holidays. Microsoft Excel offers specialized functions for wor
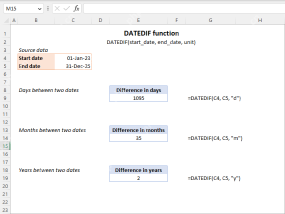 Excel DATEDIF function to get difference between two datesMay 08, 2025 am 10:45 AM
This tutorial provides a concise explanation of Excel's DATEDIF function and offers formula examples for calculating date differences in days, weeks, months, or years. We've previously covered date and time manipulation in Excel, including formattin


Hot AI Tools

Undresser.AI Undress
AI-powered app for creating realistic nude photos

AI Clothes Remover
Online AI tool for removing clothes from photos.

Undress AI Tool
Undress images for free

Clothoff.io
AI clothes remover

Video Face Swap
Swap faces in any video effortlessly with our completely free AI face swap tool!

Hot Article
Hot Tools

Safe Exam Browser
Safe Exam Browser is a secure browser environment for taking online exams securely. This software turns any computer into a secure workstation. It controls access to any utility and prevents students from using unauthorized resources.

SublimeText3 Linux new version
SublimeText3 Linux latest version

DVWA
Damn Vulnerable Web App (DVWA) is a PHP/MySQL web application that is very vulnerable. Its main goals are to be an aid for security professionals to test their skills and tools in a legal environment, to help web developers better understand the process of securing web applications, and to help teachers/students teach/learn in a classroom environment Web application security. The goal of DVWA is to practice some of the most common web vulnerabilities through a simple and straightforward interface, with varying degrees of difficulty. Please note that this software

SublimeText3 English version
Recommended: Win version, supports code prompts!

Dreamweaver Mac version
Visual web development tools

