
Home >Technology peripherals >AI >11 basic distributions that data scientists use 95% of the time
11 basic distributions that data scientists use 95% of the time

- 王林forward
- 2023-12-15 08:21:251435browse
Following the last inventory of "11 basic charts that data scientists use 95% of the time", today we will bring you 11 basic charts that data scientists use 95% of the time. distributed. Mastering these distributions helps us understand the nature of the data more deeply and make more accurate inferences and predictions during data analysis and decision-making.

1. Normal Distribution
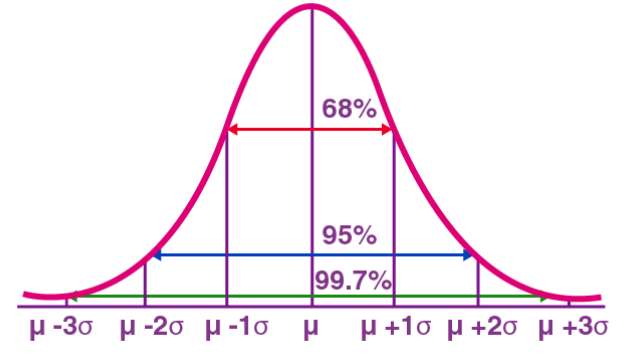
Normal Distribution, also known as Gaussian Distribution, is a continuous type Probability distributions. It has a symmetrical bell-shaped curve with the mean (μ) as the center and the standard deviation (σ) as the width. The normal distribution has important application value in many fields such as statistics, probability theory, and engineering.
The probability density function of the normal distribution can be expressed as:
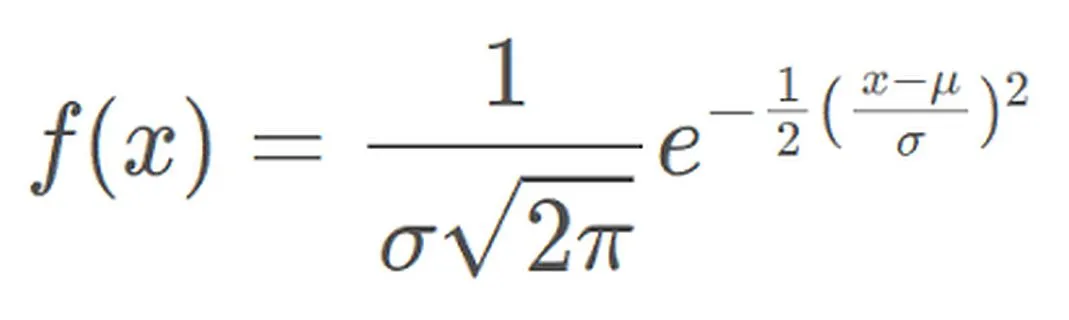
The probability density function is expressed at a given value x The probability density of the values of a normally distributed random variable within a nearby unit interval. Among them, μ represents the mean and σ represents the standard deviation.
The normal distribution is widely used in practice. For example, the distribution of human height and weight approximates a normal distribution. Furthermore, test scores are often normally distributed, with fewer people scoring high and low and more people scoring in the middle. This distribution model has important application value in many fields
2. Bernoulli distribution
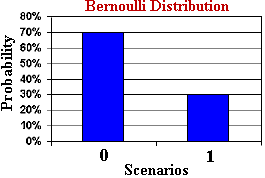
Bernoulli distribution (Bernoulli Distribution) is a discrete probability distribution used to describe A single randomized trial with only two possible outcomes. Bernoulli trials can be heads or tails, success or failure, yes or no, etc. For example, flipping a coin, testing whether a product is qualified, whether someone buys a certain product, etc.
The probability mass function of Bernoulli distribution is:
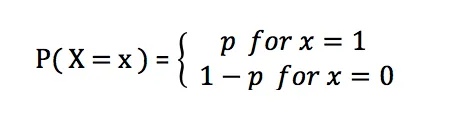
In Bernoulli distribution, p represents success The probability ranges from 0 to 1. When p equals 0.5, the Bernoulli distribution approaches a uniform distribution
Application of Bernoulli distribution in practice: For example, the binomial distribution is n independent repeated experiments of the Bernoulli distribution.
3. Binomial distribution
The Binomial distribution (Binomial Distribution) is a discrete probability distribution used to describe the probability distribution of the number of successes in n independent repeated experiments. Each trial has only two possible outcomes: success (recorded as 1) or failure (recorded as 0). The probability of success is p and the probability of failure is 1-p.
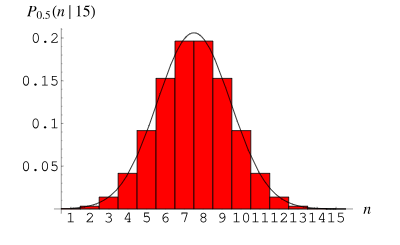
The probability mass function of the binomial distribution can be expressed as:
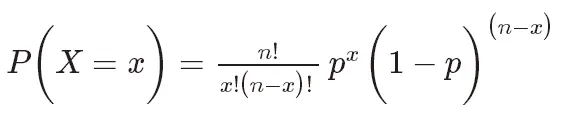
Among them, P(X=k) represents The probability that the number of successes is k,  is the number of combinations, indicating the number of k successful combinations selected from n trials. p is the probability of success, ranging from 0 to 1. n is the number of trials.
The binomial distribution is widely used in practice. For example, in medical research, we can use the binomial distribution to calculate the success rate of a patient receiving a certain treatment. In the engineering field, we can use the binomial distribution to evaluate the qualification rate of a product during the production process. These are important examples of binomial distribution in practical applications
4. Poisson distribution
Poisson distribution (Poisson Distribution) is a discrete probability distribution used to describe a fixed The probability distribution of the number of events occurring within time. The Poisson distribution is suitable for situations where events are independent and occur at a constant average rate.
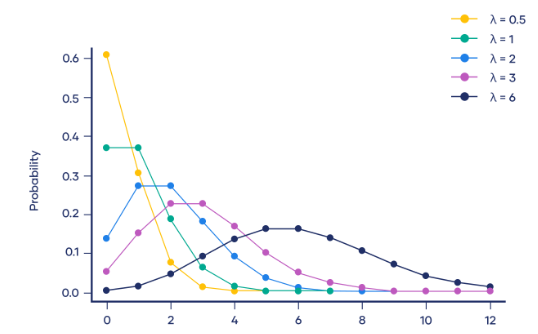
The probability density function of the Poisson distribution is:
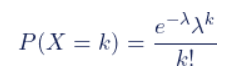
Here, P(X=k) represents the probability of an event occurring k times within a fixed period of time, and λ represents the average occurrence rate of an event, which is the average number of events occurring per unit time. e is a natural constant, approximately equal to 2.718. k represents the number of events that occur
Poisson distribution is widely used in practice. For example, in a call center, the number of calls per minute can be regarded as a Poisson distribution, where the average number of calls per minute The number of calls is λ
5. Exponential distribution
Exponential distribution (Exponential Distribution) is a continuous probability distribution used to describe the probability of an event occurring within a fixed period of time. The exponential distribution is suitable for situations where events are independent of each other and occur at a constant average rate.
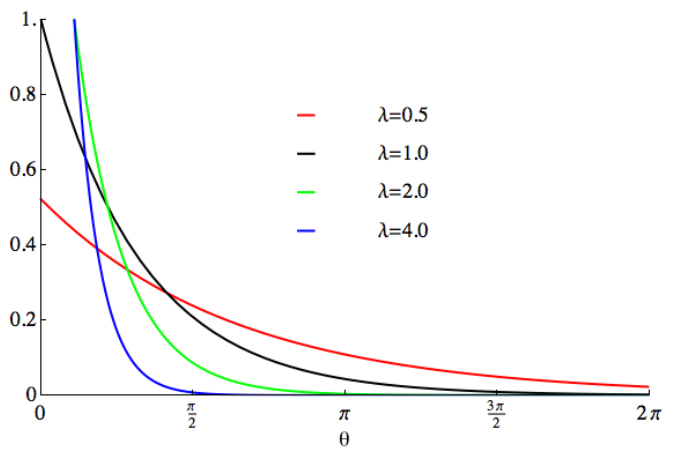
The probability density function of the exponential distribution is:

The probability density of an event occurring within a given time x is expressed by f(x,λ) represents. λ represents the average occurrence rate of events, that is, the average number of events occurring per unit time. e is a natural constant, approximately equal to 2.718
The exponential distribution has many applications in real life. For example, in radioactive decay, the decay times of radioactive nuclei can be viewed as exponentially distributed. This means that the probability distribution of decay times follows an exponential function. The average decay time corresponds to the parameter λ of the exponential function λ
6. Gamma distribution
The Gamma distribution is a continuous probability distribution used to describe the probability of an event occurring within a given time . It is suitable for situations where events are independent of each other and the average occurrence rate remains constant
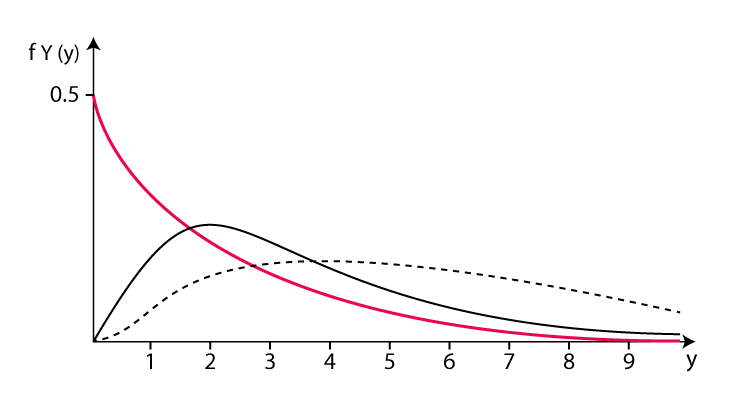
The probability density function of the gamma distribution is:
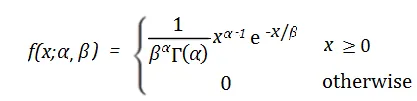
In this, f(x) represents the probability density of an event occurring within a specific time x. α and β are the shape parameters and rate parameters of the gamma distribution. α is used to determine the shape of the gamma distribution, and its value ranges from 0 to positive infinity. β represents the average occurrence rate of events, that is, the average number of events occurring per unit time, and the value range is from 0 to positive infinity. e is a natural constant, approximately equal to 2.718
Applications of gamma distribution in practice: For example, radioactive decay: In radioactive decay, the time for radioactive nuclei to decay can be regarded as a gamma distribution, and the average decay time is β/α.
7. Beta distribution
Beta distribution is a continuous probability distribution that is used to describe the probability distribution of the number of successes in a set of values. It has two parameters, representing the expected value (mean) and standard deviation (standard deviation) of the probability of success.
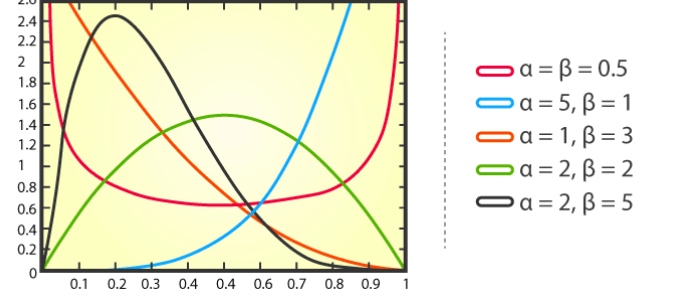
The probability density function of the beta distribution is as follows:
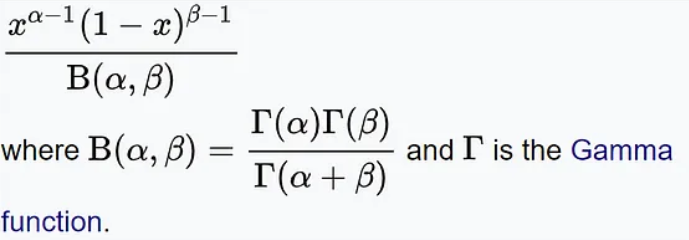
Among them, x represents the number of successes, α and β represents the shape parameters of the distribution respectively
Beta distribution has applications in many practical problems. For example, in gene editing, researchers might use a beta distribution to predict the probability that a gene-editing technology will successfully edit a certain target site. In the financial field, beta distribution can be used to describe the volatility of asset prices, or to calculate the expected return of an investment portfolio
8. Uniform distribution
The uniform distribution is a probability distribution, with Used to describe a set of values that are evenly distributed within a certain interval. There are two types of uniform distributions: discrete uniform distribution and continuous uniform distribution.
Discrete uniform distribution: When a discrete random variable We say that X obeys a discrete uniform distribution. Continuous uniform distribution: When the probability density function of a continuous random variable X is f(x) = 1/(b-a), we say that
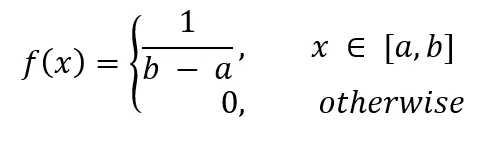 #The characteristic of uniform distribution is that within a given interval, every value has the same chance of appearing. For example, if you toss a fair coin, the probability of heads and tails is 1/2, which is a uniform distribution.
9. Lognormal distribution
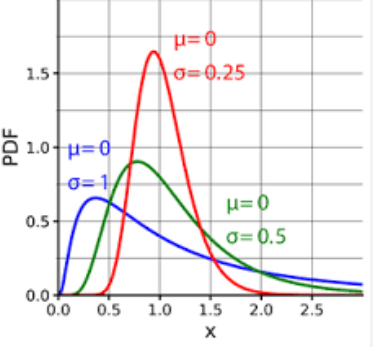
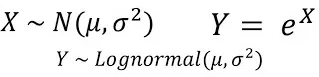
Lognormal distribution (Log-normal distribution) is a continuous probability distribution, which is characterized by the fact that the logarithm of the random variable obeys the normal distribution. In other words, if the logarithm ln(X) of a random variable X obeys the normal distribution, then the random variable X obeys the lognormal distribution.
The probability density function of the lognormal distribution can be expressed as:
where μ is the lognormal distribution is the mean of the lognormal distribution, and σ is the standard deviation of the lognormal distribution.
The lognormal distribution is of great significance in many practical applications, such as finance (stock prices, yields, etc.), biology (growth rate, etc.), economics (consumer expenditures, etc.), etc.
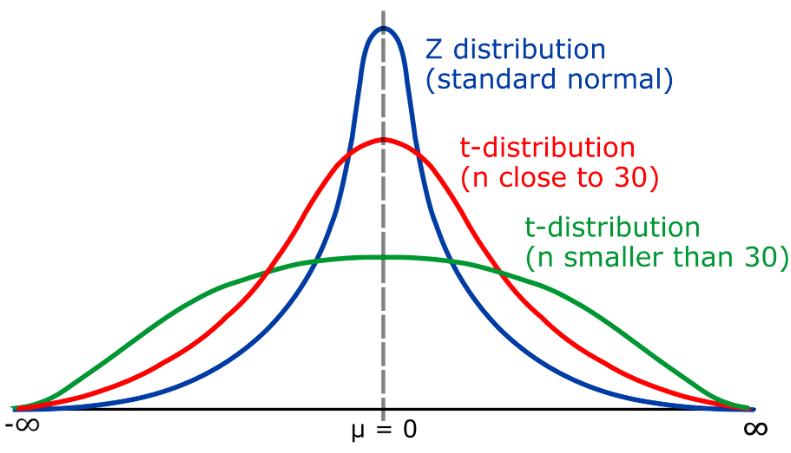
10. T distribution
T distribution is a continuous probability distribution, mainly used to describe the distribution of mean values in small sample situations. The t distribution is similar to the normal distribution, but its tail can extend to the left and right, depending on the degree of freedom (k). The t-distribution is widely used in statistical inference, such as in hypothesis testing to evaluate the significant difference between the sample mean and the population mean.
The expectation and variance of t distribution are as follows:
E(t)=0
The content to be rewritten is: Var( t)=k/(k-1)
The degrees of freedom (k) of the t distribution represent the relationship between the sample size (n) and the population standard deviation. When k > 30, the t distribution is close to the normal distribution; when k is close to 1, the t distribution becomes Cauchy distribution (Cauchy distribution)
In practical applications, when the sample size is large (n>30 ), the normal distribution can be used for hypothesis testing, and the z statistic can be used to establish a confidence interval. However, when the sample size is small (n
11. Weibull distribution
Weibull distribution (Weibull distribution) is a continuous probability distribution.
The probability density function of Weibull distribution is:

In the Weibull distribution, x is regarded as a random variable, and λ is called the scale parameter (scale ), k is the shape parameter (shape). As far as the Weber distribution is concerned, when k equals 1, it is an exponential distribution. If λ is equal to 1, this is the minimized Weibull distribution
The above is the detailed content of 11 basic distributions that data scientists use 95% of the time. For more information, please follow other related articles on the PHP Chinese website!
Related articles
See more- Why data analysts should learn python
- Detailed explanation of how Python uses Pandas for data analysis
- Eight Python libraries to improve data science efficiency!
- Developing with MySQL and Fortran: How to implement data science computing functions
- Uncovering the secrets of data science and machine learning in IoT