Home >Technology peripherals >AI >Image manipulation for digital image processing
Image manipulation for digital image processing
- PHPzforward
- 2023-12-14 17:46:031724browse
In computer vision and image processing, image operations play a vital role. These operations are critical for tasks such as preprocessing, improving image quality, and enabling advanced algorithms. In the field of computer vision, operations such as resizing, cropping, adjusting brightness/contrast/gamma, and geometric transformations are fundamental operations. They enable efficient computation, extraction of regions of interest, normalization of image intensities and geometric calibration. In terms of image processing, these operations are also critical for downsampling, cropping irrelevant areas, improving visibility and quality, and performing geometric operations

Resizing
Resizing images is common in various scenarios and can serve different purposes, such as fitting an image to a specific size or reducing the file size. Image interpolation and resampling are techniques used in image processing and computer vision to resize or scale images.
Image interpolation
Image interpolation refers to the process of estimating pixel values at unknown positions in the image based on known pixel values. Different interpolation methods use different ways to estimate the value of unknown pixels
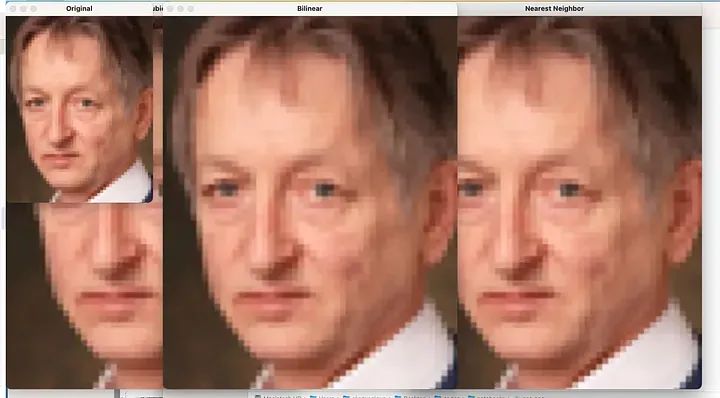
rewritten as follows: Nearest neighbor interpolation is a method of assigning the value of an unknown pixel location to the nearest known pixel value. Although this method is simple, it can lead to problems with blocking artifacts and loss of detail
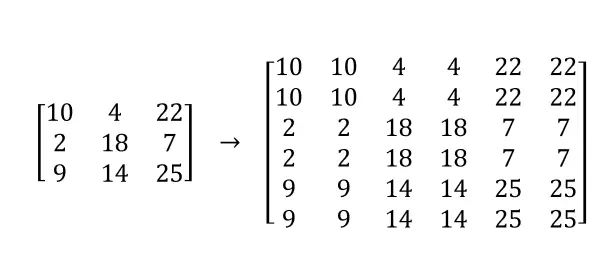
Nearest Neighbor Interpolation
The bilinear interpolation algorithm takes into account the four nearest known pixel values and uses a weighted average to estimate the value of the unknown pixel. Bilinear interpolation produces smoother results than nearest neighbor interpolation, but may still introduce some blurring effects
Bicubic interpolation works by considering more neighboring pixels and using Cubic polynomials are used to estimate pixel values, extending bilinear interpolation. This method can provide higher quality results, with smoother transitions and better preservation of image details.
import cv2import numpy as npdef resize_image(image, scale, interpolation):width = int(image.shape[1] * scale)height = int(image.shape[0] * scale)resized_image = cv2.resize(image, (width, height), interpolation=interpolation)return resized_imageSCALE = 4# Load the imageimage_path = "image.png"image = cv2.imread(image_path)# Resize the image using nearest neighbor interpolationnearest_neighbor_resized = resize_image(image, scale=SCALE, interpolation=cv2.INTER_NEAREST)# Resize the image using bilinear interpolationbilinear_resized = resize_image(image, scale=SCALE, interpolation=cv2.INTER_LINEAR)# Resize the image using bicubic interpolationbicubic_resized = resize_image(image, scale=SCALE, interpolation=cv2.INTER_CUBIC)
Crop
The purpose of cropping an image is to remove unwanted content or focus on a specific area of interest. Cropping allows you to optimize your composition, remove distractions, and highlight important elements of your image. Removing unnecessary or irrelevant parts creates a visually appealing and impactful image that effectively conveys the intended message or theme.
Different methods can be used to determine the cropping area:
- Manual selection: Manual cropping involves visual inspection of the image and selecting the desired area to retain . This approach provides flexibility and allows for subjective decisions to be made based on the artistic judgment of the photographer or designer.
- Object Detection: Automatic cropping technology based on object detection algorithms can identify and extract specific objects or themes in images. These algorithms analyze images and locate objects based on predefined patterns or trained models. Detected objects can be used as cropping regions, ensuring important elements are retained while irrelevant background or surrounding areas are removed.
- Segmentation: Image segmentation techniques such as semantic segmentation or instance segmentation can be used to divide images into meaningful regions. These techniques assign labels or masks to different objects or regions, making it possible to crop specific parts or isolate specific areas of interest.
import cv2def crop_image(image, x, y, width, height):cropped_image = image[y:y+height, x:x+width]return cropped_image# Example usageimage = cv2.imread("cath.jpeg")cropped_image = crop_image(image, x=400, y=500, width=300, height=200)cv2.imshow("Cropped Image", cropped_image)cv2.waitKey(0)cv2.destroyAllWindows()
Adjustment
Brightness and Contrast:
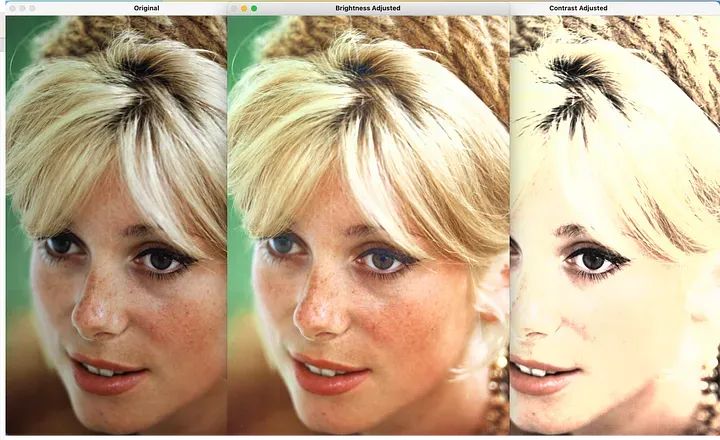
Adjust the brightness and contrast for enhanced image visibility and Improving visual appeal is crucial. Adjusting brightness can make an image appear brighter or darker, highlighting details in underexposed or overexposed areas. Contrast adjustment enhances the difference between light and dark areas, making images appear clearer and more dynamic.
By adjusting brightness and contrast, you can improve the overall quality and readability of your image, ensuring that important features are clearly visible
import cv2import numpy as npimage_path = "cath.jpeg"def adjust_brightness(image, value):# Convert the image to the HSV color spacehsv = cv2.cvtColor(image, cv2.COLOR_BGR2HSV)# Split the channelsh, s, v = cv2.split(hsv)# Apply the brightness adjustmentv = cv2.add(v, value)# Clamp the values to the valid range of 0-255v = np.clip(v, 0, 255)# Merge the channels back togetherhsv = cv2.merge((h, s, v))# Convert the image back to the BGR color spaceadjusted_image = cv2.cvtColor(hsv, cv2.COLOR_HSV2BGR)return adjusted_imagedef adjust_contrast(image, value):# Convert the image to the LAB color spacelab = cv2.cvtColor(image, cv2.COLOR_BGR2LAB)# Split the channelsl, a, b = cv2.split(lab)# Apply the contrast adjustmentl = cv2.multiply(l, value)# Clamp the values to the valid range of 0-255l = np.clip(l, 0, 255)# Merge the channels back togetherlab = cv2.merge((l, a, b))# Convert the image back to the BGR color spaceadjusted_image = cv2.cvtColor(lab, cv2.COLOR_LAB2BGR)return adjusted_image# Load the imageimage = cv2.imread(image_path)# Adjust the brightnessbrightness_adjusted = adjust_brightness(image, value=50)# Adjust the contrastcontrast_adjusted = adjust_contrast(image, value=2)# Display the original and adjusted imagescv2.imshow("Original", image)cv2.imshow("Brightness Adjusted", brightness_adjusted)cv2.imshow("Contrast Adjusted", contrast_adjusted)cv2.waitKey(0)cv2.destroyAllWindows()
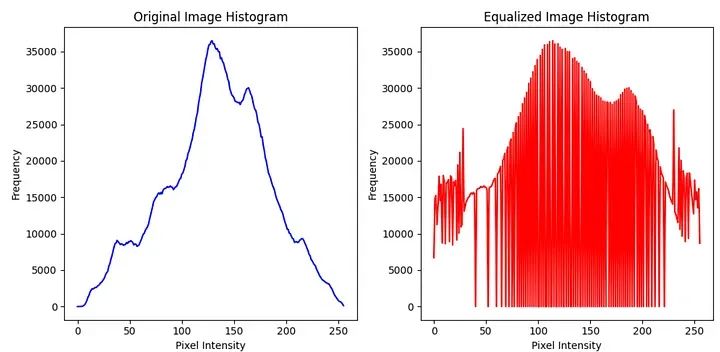
Histogram is a chart used to show the distribution of data. It divides the data into several intervals, counts the number of data in each interval, and then draws vertical bars to represent the number of data in each interval. Histograms can help us intuitively understand the distribution characteristics of data, such as the degree of data concentration, skewness, and the existence of outliers. By looking at histograms, we can better understand and analyze the data to make more accurate decisions and predictions. In fields such as statistics, market research, and financial analysis, histograms are widely used in data analysis and visual equalization
直方图是一种用于展示数据分布情况的图表。它将数据分成若干个区间,并统计每个区间内的数据数量,然后通过绘制垂直条形来表示各个区间的数据数量。直方图可以帮助我们直观地了解数据的分布特征,例如数据的集中程度、偏态以及异常值的存在等。通过观察直方图,我们可以更好地理解和分析数据,从而做出更准确的决策和预测。在统计学、市场研究、金融分析等领域,直方图被广泛应用于数据分析和可视化均衡化是一项用于增强对比度的技术。它通过重新分配像素强度值来覆盖更广范围的值,以实现此目的。其主要目标是通过图像获得更均匀分布的像素强度
通过重新分配像素强度,直方图是一种用于展示数据分布情况的图表。它将数据分成若干个区间,并统计每个区间内的数据数量,然后通过绘制垂直条形来表示各个区间的数据数量。直方图可以帮助我们直观地了解数据的分布特征,例如数据的集中程度、偏态以及异常值的存在等。通过观察直方图,我们可以更好地理解和分析数据,从而做出更准确的决策和预测。在统计学、市场研究、金融分析等领域,直方图被广泛应用于数据分析和可视化均衡化增强了图像的对比度。
import cv2import matplotlib.pyplot as pltimage_path = "cath.jpeg"image = cv2.imread(image_path, cv2.IMREAD_GRAYSCALE)# Apply histogram equalizationequalized_image = cv2.equalizeHist(image)# Calculate histogramshist_original = cv2.calcHist([image], [0], None, [256], [0, 256])hist_equalized = cv2.calcHist([equalized_image], [0], None, [256], [0, 256])# Plot the histogramsplt.figure(figsize=(10, 5))plt.subplot(1, 2, 1)plt.plot(hist_original, color='b')plt.title("Original Image Histogram")plt.xlabel("Pixel Intensity")plt.ylabel("Frequency")plt.subplot(1, 2, 2)plt.plot(hist_equalized, color='r')plt.title("Equalized Image Histogram")plt.xlabel("Pixel Intensity")plt.ylabel("Frequency")plt.tight_layout()plt.show()
直方图是一种用于展示数据分布情况的图表。它将数据分成若干个区间,并统计每个区间内的数据数量,然后通过绘制垂直条形来表示各个区间的数据数量。直方图可以帮助我们直观地了解数据的分布特征,例如数据的集中程度、偏态以及异常值的存在等。通过观察直方图,我们可以更好地理解和分析数据,从而做出更准确的决策和预测。在统计学、市场研究、金融分析等领域,直方图被广泛应用于数据分析和可视化
# Display the original and equalized imagesfig, axes = plt.subplots(1, 2, figsize=(10, 5))axes[0].imshow(image, cmap='gray')axes[0].set_title("Original")axes[0].axis("off")axes[1].imshow(equalized_image, cmap='gray')axes[1].set_title("Equalized")axes[1].axis("off")plt.tight_layout()plt.show()
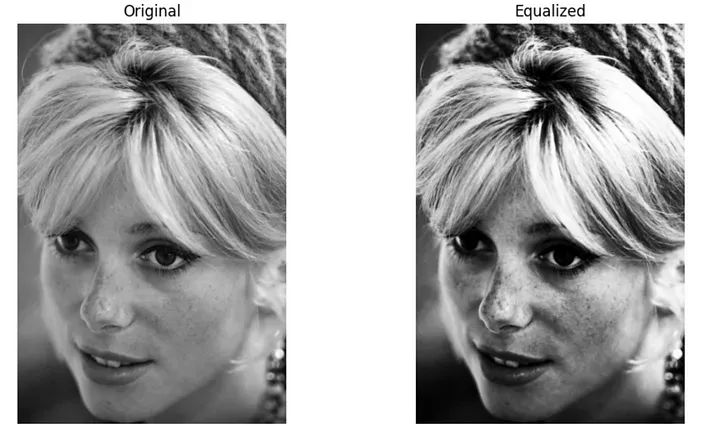
均衡化图像
缩放比例相等的比例尺称为线性缩放
缩放比例相等的比例尺称为线性缩放,也被称为对比度拉伸,用于调整图像的亮度和对比度,通过线性映射原始像素值到一个新的范围。该过程涉及重新缩放像素值,以利用图像中的最小值和最大值的完整动态范围
缩放比例相等的比例尺称为线性缩放的好处在于可以精确地控制亮度和对比度的调整。您可以根据具体需求定义所需的强度范围
import cv2import numpy as npimport matplotlib.pyplot as plt# Load the imageimage_path = "cath.jpeg"image = cv2.imread(image_path, cv2.IMREAD_GRAYSCALE)# Calculate the minimum and maximum pixel values in the imagemin_value = np.min(image)max_value = np.max(image)# Define the desired minimum and maximum intensity values for the output imagenew_min = 5new_max = 10# Perform linear scalingscaled_image = cv2.convertScaleAbs(image, alpha=(new_max - new_min) / (max_value - min_value), beta=new_min - min_value * (new_max - new_min) / (max_value - min_value))# Display the original and scaled imagesfig, axes = plt.subplots(1, 2, figsize=(10, 5))axes[0].imshow(cv2.cvtColor(image, cv2.COLOR_GRAY2RGB))axes[0].set_title("Original")axes[0].axis("off")axes[1].imshow(scaled_image, cmap='gray')axes[1].set_title("Scaled")axes[1].axis("off")plt.tight_layout()plt.show()
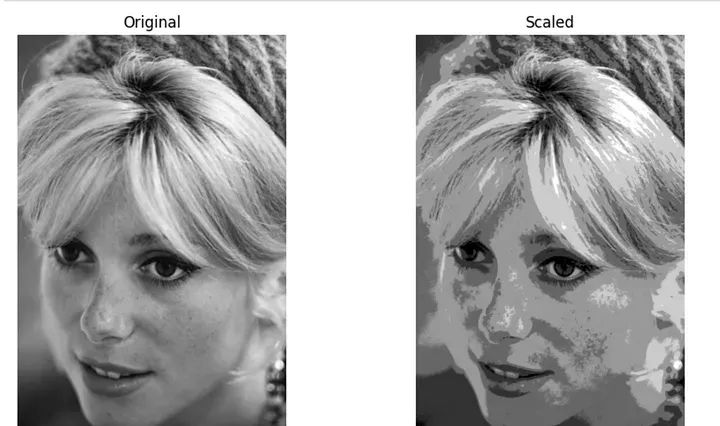
缩放比例相等的比例尺称为线性缩放
重写内容:Gamma 校正
重写内容:Gamma 校正是一种技术,用于调整图像输入像素值和显示输出强度之间的非线性关系。它考虑到人类视觉系统对光的非线性响应,并旨在实现更准确和与感知一致的图像显示
相机捕捉或存储在图像文件中的像素值与人类感知亮度之间的关系是非线性的。换句话说,像素值的线性增加并不导致感知亮度的线性增加。这种非线性关系是由于成像传感器和人类视觉系统的响应特性导致的。
重写内容:Gamma 校正基于一个称为伽马(γ)的参数。伽马值表示输入像素值和显示输出强度之间的关系。它是两者之间非线性映射的度量。
重写内容:Gamma 校正对像素值应用幂律变换,调整强度值以校正非线性响应。重写内容:Gamma 校正的公式如下:
校正值 = 输入值 ^ (1 / 伽马)
这里,输入值代表原始像素值,校正值代表调整后的像素值。
重写内容:Gamma 校正的主要作用是补偿非线性强度关系,确保图像中的颜色和细节得到准确的表示。重写内容:Gamma 校正发挥重要作用的方式如下:
- 亮度补偿:重写内容:Gamma 校正有助于弥补捕捉和显示设备之间亮度响应的差异。它确保显示图像中的感知亮度水平与原始场景一致。
- 对比度增强:重写内容:Gamma 校正可以通过重新分配色调值来增强图像的对比度。根据伽马值的不同,它可以有效地强调图像的暗区域或亮区域中的细节。
- 色彩准确性:重写内容:Gamma 校正有助于实现准确的颜色表示。通过调整伽马值,可以改善颜色再现,确保颜色看起来更自然且忠实于原始场景。
- 色调映射:在高动态范围(HDR)成像中,重写内容:Gamma 校正常常作为色调映射技术的一部分,将场景的广泛动态范围映射到显示设备的有限动态范围。重写内容:Gamma 校正有助于保持阴影和高光区域的细节,防止信息丢失。
- 感知一致性:重写内容:Gamma 校正旨在实现感知上一致的图像,其中显示的强度与人类视觉感知一致。通过校正非线性响应,重写内容:Gamma 校正确保图像对观众呈现出视觉上愉悦和逼真的效果。
import cv2import numpy as npimage_path = "cath.jpeg"def adjust_gamma(image, gamma):# Build a lookup table mapping the input pixel values to the corrected gamma valueslookup_table = np.array([((i / 255.0) ** gamma) * 255 for i in np.arange(0, 256)]).astype(np.uint8)# Apply gamma correction using the lookup tablegamma_corrected = cv2.LUT(image, lookup_table)return gamma_corrected# Load the imageimage = cv2.imread(image_path)# Adjust the gamma valuegamma_value = 1.5gamma_corrected = adjust_gamma(image, gamma_value)# Display the original and gamma-corrected imagescv2.imshow("Original", image)cv2.imshow("Gamma Corrected", gamma_corrected)cv2.waitKey(0)cv2.destroyAllWindows()
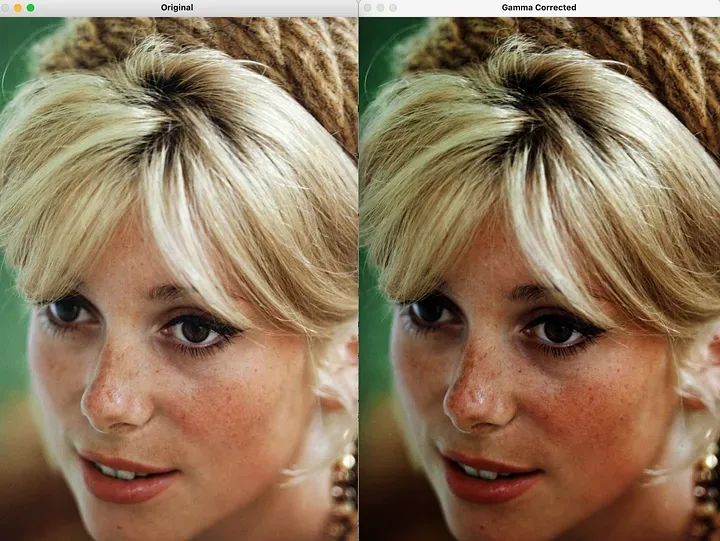
重写内容:Gamma 校正
几何变换
几何变换使图像的透视、方向和空间关系发生变化。这些变换为图像对齐、目标检测、图像注册等任务提供了基本工具。
(1) 平移
移动是几何变换的基本形式之一,它涉及将图像在水平或垂直方向上移动指定的距离
import cv2import numpy as npimage_path = "cath.jpeg"image = cv2.imread(image_path)# Define the translation matrixtx = 100# pixels to shift in the x-axisty = 50# pixels to shift in the y-axistranslation_matrix = np.float32([[1, 0, tx], [0, 1, ty]])# Apply translationtranslated_image = cv2.warpAffine(image, translation_matrix, (image.shape[1], image.shape[0]))# Display the original and translated imagescv2.imshow("Original", image)cv2.imshow("Translated", translated_image)cv2.waitKey(0)cv2.destroyAllWindows()
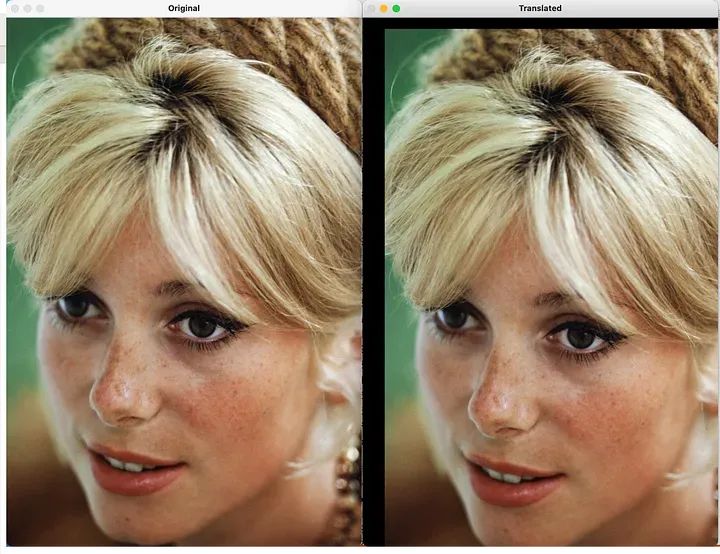
平移
(2) 缩放
缩放是指调整图像的大小,可以通过对所有维度应用统一的缩放因子,或者使用不同的缩放因子来调整不同的维度。已缩放。
# Define the scaling factorsscale_x = 1.5# scaling factor for the x-axisscale_y = 0.8# scaling factor for the y-axis# Apply scalingscaled_image = cv2.resize(image, None, fx=scale_x, fy=scale_y, interpolation=cv2.INTER_LINEAR)# Display the original and scaled imagescv2.imshow("Original", image)cv2.imshow("Scaled", scaled_image)cv2.waitKey(0)cv2.destroyAllWindows()
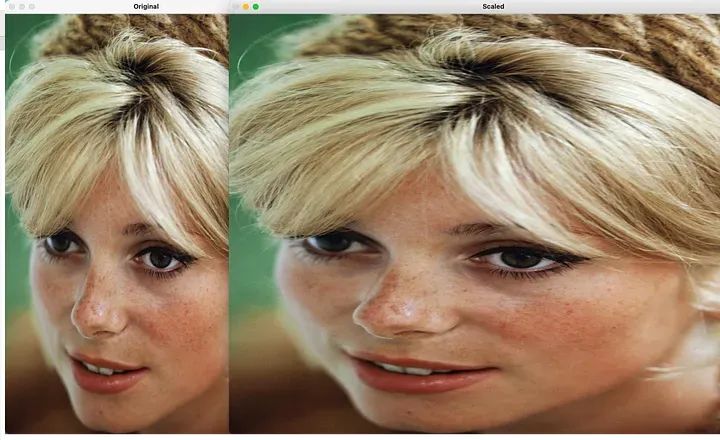
缩放
(3) 进行重写的内容是:旋转
进行重写的内容是:旋转是一种几何变换,涉及围绕中心点按指定角度更改图像的方向。
# Define the rotation angleangle = 30# Perform rotationrows, cols = image.shape[:2]rotation_matrix = cv2.getRotationMatrix2D((cols / 2, rows / 2), angle, 1)rotated_image = cv2.warpAffine(image, rotation_matrix, (cols, rows))# Display the original and rotated imagescv2.imshow("Original", image)cv2.imshow("Rotated", rotated_image)cv2.waitKey(0)cv2.destroyAllWindows()
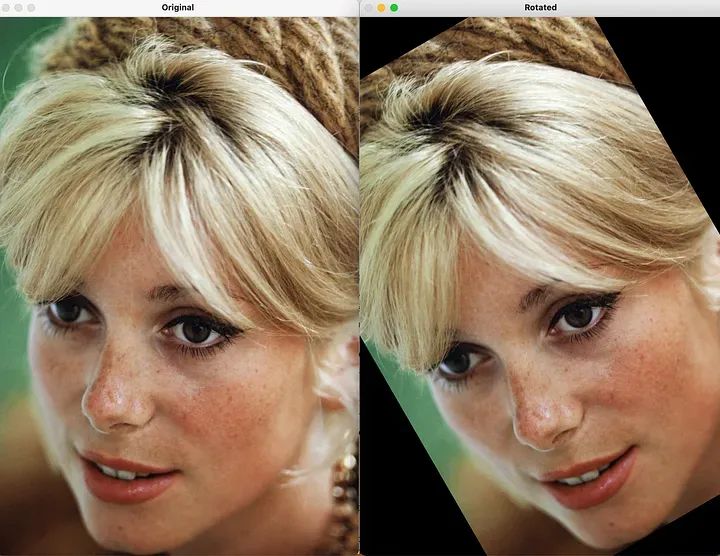
进行重写的内容是:旋转
The above is the detailed content of Image manipulation for digital image processing. For more information, please follow other related articles on the PHP Chinese website!
Related articles
See more- Technology trends to watch in 2023
- How Artificial Intelligence is Bringing New Everyday Work to Data Center Teams
- Can artificial intelligence or automation solve the problem of low energy efficiency in buildings?
- OpenAI co-founder interviewed by Huang Renxun: GPT-4's reasoning capabilities have not yet reached expectations
- Microsoft's Bing surpasses Google in search traffic thanks to OpenAI technology

