


How does NetEase detect and diagnose abnormal data indicators?


1. Background introduction
Indicators are closely related to business, and their value lies in discovering problems and highlights so that problems can be solved in a timely manner and promotion highlights. With the further development of e-commerce business, the business iteration is fast, the logic is complex, the number of indicators is increasing, and the differences between indicators are very large and change very quickly. How can we quickly identify the abnormal indicators of the system and find the problem? Root cause is critical to the business. If the alarm threshold is set manually, omissions may easily occur, and it is very time-consuming and costly. We hope to build a set of automated methods that can achieve the following goals:
- #Automation does not need to rely on user input: the traditional method requires defining exception rules, attribution dimensions, etc. Etc., manual user input is no longer required in automated systems.
- Versatility: It can adapt to a variety of indicator distributions, and different indicators match different methods.
- # Timeliness: Achieve day-level and hour-level indicator anomaly detection and attribution.
- #Accuracy and initiative: achieve the goal of finding people through data.
# Next, we will introduce indicator anomaly detection and indicator anomaly diagnosis respectively.
2. Indicator anomaly detection
1. What are the anomalies
The first step in data science work is to analyze the problem Define. Our definition of abnormality is abnormality of data indicators. Too high or too low indicators, ups and downs, are abnormal and require early warning and diagnosis. Indicator anomalies are divided into the following three types:

- Absolute value anomaly
refers to statistical outliers that do not follow the inherent distribution of indicators. It reflects the current status of the business.
- Abnormal fluctuations
Sudden increase or decrease points that are too large compared to the previous period, It reflects the current sudden changes in the business.
- Trend abnormality
The first two kinds of abnormality are single-point and short-lived. Violent, while some anomalies are relatively hidden. They show a deterministic upward or downward trend in the medium to long term, which often indicates certain potential risks. Therefore, we must also detect trend anomalies and carry out business warnings and early intervention.
These three types of exceptions are independent of each other, and different scenarios may correspond to different types of exceptions.
For example, point A in the above figure has both absolute value anomaly and volatility anomaly. Point B only reports absolute value anomaly because it has not changed much from the previous day. Both points C and D only reported fluctuation abnormalities, but the reasons are different. The sudden drop in the indicator at point C was caused by point B, which is a normal drop in the indicator. This needs to be solved through post-processing logic.
2. Indicator abnormality detection framework

In order to realize the versatility, automation and timeliness of indicator detection, we designed An unsupervised detection framework based on statistical testing.
- Absolute value anomaly detection
First of all, absolute value detection is mainly based on the GESD test algorithm , its principle is to find outliers by calculating statistics. The process is as follows:
Assume that there are at most r outliers in the data set. The first step is to find the sample i that is the largest distance from the mean, and then calculate the statistic Ri, which is the absolute value of xi minus the mean, divided by the standard deviation. Next, calculate the critical value λi of the corresponding sample point i, where n is the total sample size, i is the number of samples that have been eliminated, and t has n-i-1 degrees of freedom. The p percentage point of the t distribution, and p is related to the set confidence α (generally the value of α is 0.05) and the current sample size.
The second step is to eliminate the sample i that is the largest distance from the mean, and then repeat the above steps for a total of r times.
The third step is to find samples whose statistics Ri is greater than λi, which are abnormal points.
The advantages of this method are: first, there is no need to specify the number of outliers, only the upper limit of the exception needs to be set. Within the upper limit, the algorithm will automatically capture the outliers; second, It overcomes the problem that the 3Sigma detection rate is too low (less than 1%) and can only detect very extreme anomalies.
In the GESD algorithm, adaptation can be made by controlling the upper limit of the detection rate, but the premise of this method is that the input indicators are required to be normally distributed. Most of the e-commerce business indicators we currently observe are normally distributed. Of course, there are also individual business indicators (
- Voltage anomaly detection
The second type is fluctuation anomaly detection, which is mainly based on the volatility distribution and calculates the inflection point of the distribution. The above method cannot be directly applied to the volatility distribution here, mainly because most of the indicator volatility is not normally distributed, so it is not applicable. The principle of finding the inflection point is to find the maximum bending point on the curve based on the second derivative and distance. The increasing volatility is greater than 0, and the decreasing volatility is less than 0. For the parts greater than 0 and less than 0 on both sides of the y-axis, two inflection points of volatility should be found respectively. If the volatility exceeds the range of the inflection point, it is considered to be an abnormal fluctuation. . However, in some cases, the inflection point may not exist, or the inflection point may come too early, causing the detection rate to be too high. Therefore, other methods are also needed to find out, such as quantile. One inspection method is not a panacea and needs to be used in combination.
- Trend anomaly detection
The third type is trend anomaly detection, based on the Man-Kendall test. First calculate the statistic S, where sgn is the sign function. According to the relative size relationship between the values before and after the indicator sequence, three mapping values such as -1, 1, and 0 can be obtained by pairing them in pairs. By standardizing the statistic S, we get Z, which can be converted to a p-value by looking up the table. Statistically, a significant trend is considered when the p-value is less than 0.05.
The first advantage is that it is a non-parametric test, which can be applied to all distributions, so there is no need for a bottom-up method. The second advantage is that the indicator sequence is not required to be continuous, because when detecting trend anomalies, samples with abnormal absolute values need to be eliminated in advance, so most indicator sequences are not continuous, but this method can support discontinuous indicators.
- Exception detection post-processing
After the three exceptions are completed, post-processing work is required. The purpose is mainly to reduce unnecessary alarms. , reduce interruption to business.
The first type is data anomaly. This data anomaly does not mean that the data source is wrong, because the data source is at the data warehouse level and is guaranteed by the data warehouse team. The data anomaly here refers to the abnormal fluctuations in the current cycle caused by the anomalies in the previous cycle. For example, an indicator rose by 100% yesterday and dropped by 50% today. In this case, it needs to be eliminated based on rules. The conditions for elimination That is (1) there were fluctuations or absolute value anomalies in the previous cycle (2) the fluctuations in this cycle are returning to normal, that is, there are fluctuations but no absolute value anomalies in the same direction as the fluctuations. For example, if it rose by 100% yesterday and dropped by 50% today, it will be filtered out by the post-processing module. However, if it dropped by 99%, an absolute value anomaly will still be triggered and a warning will be required. In this way, we eliminated a total of more than 40% of fluctuation anomalies.
The second kind of post-processing is based on the information collaboration of S-level promotions. In this kind of promotion, abnormal indicators may occur every hour. Everyone knows the reason, so there is no It is necessary to report.
3. Indicator abnormality diagnosis
1. Diagnosis of indicator abnormality levels
According to the feasible region and certainty of the conclusion , inference can be divided into three levels, namely deterministic inference, possible inference and speculative inference.

2. Comparison of indicator anomaly diagnosis methods
Different inference levels correspond to different diagnostic methods.

#Speculative inference, the conclusion mainly relies on human experience, the conclusion is relatively unclear, the operable space is limited, and it is not within the scope of the method discussion in this article .
Possibility inference, (1) can be based on machine learning to fit indicator data, make regression predictions, and calculate the importance of features. The disadvantage of this method is that it cannot explain the cause of a single anomaly. (2) If you want to explain a single anomaly, you need to add a shap value algorithm, which can calculate each predicted value and the contribution value of each input feature to the target. This method has a certain interpretability, but it is not accurate enough, and it can only draw correlation, not causation. (3) Bayesian networks can be used to construct graphs and networks of relationships between indicators, but the disadvantage is that the calculation is relatively complex and black box.
Deterministic inference is mainly based on the disassembly contribution algorithm. Whether the dismantling contribution algorithm is addition, multiplication or division, it measures the impact of changes in the indicators or structure of each part on the whole according to the disassembly method. The advantage is that it is relatively deterministic, white-boxed, highly adaptable, and can accurately locate the location of anomalies. However, it also has its natural shortcomings, that is, there are many dimensions that can be disassembled for the same indicator, which will lead to the problem of explosion of combined dimensions.
3. Business Current Situation
Many problems in data science require the selection of corresponding methods based on the actual business scenarios. Therefore, before introducing our approach, let’s introduce the current situation of the business.

We know that the growth of platform e-commerce is driven by traffic retention and paid conversion. As the demographic dividend peaks and it becomes increasingly difficult to obtain traffic, NetEase Yanxuan has carried out strategic upgrades, transforming from platform e-commerce to brand e-commerce, and turning platform e-commerce companies such as JD.com and Taobao into brand partners.
The growth-driven method of brand e-commerce is to break through with explosive products through omni-channel collaboration and create star categories to establish the brand. For example, you may not necessarily know NetEase Yanxuan through our APP, but may learn about our brand through buying some products on Taobao and JD.com. NetEase Yanxuan's growth perspective has shifted from focusing on user acquisition, retention, and payment, to focusing on the creation of hot products and the breakthrough growth of channels.
The indicator grading of brand e-commerce can be divided into strategic layer, tactical layer and execution layer. The strategic layer corresponds to the first-level indicator, the North Star indicator. For example, the GMV of the market measures the achievement of goals and serves the company's strategic decisions. The tactical layer corresponds to the second-level indicators, which are obtained by splitting the first-level indicators into departments and business lines at all levels, and serve process management. The execution layer corresponds to the third-level indicators, which further splits the second-level indicators into categories of products and persons in charge at all levels, and services are implemented in detail.
Based on the current index grading method of brand e-commerce and the need to locate departments, people, and products, our algorithm needs to be deterministic, interpretable, and White boxing. Therefore, we adopted a disassembly-based method to calculate the impact of each layer's indicators on the whole, which is the dismantling contribution method mentioned above.
4. Disassembly contribution calculation method
There are three ways to calculate contribution, one is addition, one is multiplication, and the other is division .

The disassembly method is as shown in the picture above. Y is the target indicator to be dismantled, such as the GMV of the market, and Xi is the i-th dimension value under a certain splitting dimension, such as the GMV of a certain province or city, Xi1 represents the indicator of the current period, and Xi0 represents the original value of the previous period.
The dismantling formula of addition is easy to understand. The change value of each dimension value ΔXi is divided by the overall original value Y0 , is its contribution.
The multiplication decomposition adopts the LMDI (Logarithmic Mean Index Method) product factor decomposition method. By taking the logarithm ln on both sides at the same time, the additive form can be obtained. Then according to the above method, the contribution of each factor can be obtained. The greater the front-to-back ratio of dimension values, the greater the contribution.
The division method adopts a two-factor disassembly method, that is, the contribution of each part and each dimension value to the whole is composed of two factors. The first factor is the fluctuation contribution, represented by AXi ; the second factor is the structural change contribution BXi, that is, the structural change contribution of each part. For example, each division's gross margin increased but the company's overall gross margin fell. The reason is most likely that the sales proportion of a certain low-margin department has increased, dragging down the whole. This is the situation we are familiar with Simpson's Paradox. In the division disassembly algorithm, this problem can be solved by introducing the contribution of the structural change of BXi.
A very important feature of contribution is additivity, which satisfies the MECE principle of no repetition or omission. No matter which disassembly method is used, the overall change rate ΔY% can be obtained by adding up all the dimension value contributions CXi under a certain disassembly dimension.
5. Dimension explosion problem of indicator disassembly

Suppose we dismantle the abnormal cause of a first-level indicator. For example, sales or gross profit, etc., the dimensions of splitting can be sales channels or provinces, cities and regions, or they can also be based on product categories, new and old customers, etc. Assuming there are n split dimensions, then it is necessary to generate an intermediate table corresponding to n dimensions, and then calculate the indicator change for each dimension value Xi under each dimension to obtain its contribution.
In order to accurately find the cause of indicator anomalies, the problem is that only a single dimension can be disassembled, and only the conclusion of that dimension can be obtained, and the precise problem cannot be located. If the disaggregated dimensions are too detailed, for example, if all dimensions are combined, then the contribution of each item is too small, and the main reason cannot be obtained. So here we need to drill down and exhaustively, searching for the conclusion we want in various combinations of dimensions.
Assuming that there are currently n split dimensions, you need to first create 2n intermediate tables. During the process of establishing the intermediate tables, ensure that the calibers are consistent, and To meet the data warehouse specifications, the workload is very large. After these intermediate tables are built, the API of the disassembly algorithm is called to calculate the corresponding contribution. This results in very large calculation and storage consumption, that is, the problem of dimensionality explosion.
6. Optimization of the dimension explosion problem of indicator disassembly

In order to solve the problem of dimension explosion, the implementation plan has been optimized as follows :
Optimization 1: Transform the process of dimension disassembly into contribution-based aggregation. As mentioned earlier, because the contribution is additive, the algorithm is first called to calculate the contribution of the most fine-grained final indicator, and then which dimension of contribution is needed, use it to do the group by condition to sum the contribution. . This can omit the IO process of the intermediate table and only requires one algorithm call. Performing the summation operation on the cluster will be much faster than calling the indicator disassembly algorithm.
The above is an abnormal diagnosis for the first-level indicators. In our actual business, we also need to diagnose the second-level indicators. This method only needs to normalize the contribution once more. That’s it, there is no need to repeat calculations, and abnormal diagnosis can be performed simultaneously for primary and secondary indicators.
The problem of computational efficiency has been solved, but there is still a problem, that is, the space complexity of the result is very large, reaching  . Assuming that k is the average number of dimension values in each dimension, single-dimensional dismantling space
 Two-dimensional dismantling space
 Three-dimensional dismantling space
  n-dimensional dismantling space
 =
= .
.

Optimization 2: Limit the combination of dimensions to implement pruning according to actual business needs, reducing the space complexity of the result from  to
to
 Within the picture
. Specifically, it includes two operations. The first is to group dimensions. For dimensions with natural hierarchical relationships, such as first-level channels and second-level channels, if it is split into second-level channels, the first-level channel information is already available, so there is no need. To make a redundant combination of first-level channels and second-level channels, you only need to combine the dimensions across groups. The second is to limit the number of dimension combinations, because during attribution diagnosis analysis, actual business will not pay attention to particularly complex dimensions. Generally, a combination of two or three dimensions is enough.
Optimization 3: Based on dimension Gini coefficient sorting, determine the best dimension and achieve abnormally precise positioning. With several split degrees and corresponding dimension value contributions after pruning, how can we select the best among them and locate the main reason? The intuitive idea is that the finer the granularity of a certain dimension and the greater the contribution of the top dimension value of the head, the more likely it is the main cause of indicator anomalies. The Gini coefficient is a more suitable measurement method for this scenario. The smaller the square sum of the contribution of each part minus 1, the more reasonable the split dimensions are.
The right side of the picture above gives an example. For a certain sales abnormality, the first method is to split it according to the product dimension. Because the contribution of each product is too small, the Gini coefficient Very big. The second method is to dismantle the secondary channels according to the granularity. The granularity is relatively coarse, and the calculated Gini coefficient may be a relatively large value. The third method is calculated based on the first-level industry multiplied by the second-level channels. The Gini coefficient is likely to be even smaller, because the second-level channels drill down one level further, and some parts have positive contributions and some parts have negative contributions. contribution. Positive contribution is the part that has a positive effect on the fluctuation of the indicator, and negative contribution is the part that has a negative effect. In this example, we can see that the split dimension industry 1 crosses channel 1 with a contribution of 60%, which is classified as the main cause, which is more in line with our understanding. Therefore, through the Gini coefficient, we can find more reasonable split dimensions and the main causes of indicator anomalies.
4. QA
#Q1: What indicators are used to evaluate the accuracy of diagnosis?
A1: Because we use deterministic diagnosis, the conclusion is very clear. If you look at it from the perspective of pure indicators, accuracy is ensured by calculating and writing code. From the perspective of business understanding, for example, this exception is due to a certain business performing a normal operation, or false positives or false negatives due to other reasons. In this case, the accuracy is evaluated by collecting bad cases. .
Q2: Will the dismantling of contribution points be mixed? For example, when GMV is dismantled, addition is initially used to dismantle channels, and then multiplication formula is used. How to judge the order of using different dismantling methods?
A2: This is a very good practical question. First of all, it is feasible to use the idea of mixing addition and multiplication. You can use a greedy way to search, calculate the corresponding contribution of the TOP dimension value of each step and the contribution after disassembly in the next step, and determine it based on the decrease in contribution. The next step is to break it down by addition or multiplication.
Another way of thinking is to first follow a certain direction. For example, for e-commerce GMV, you can first dismantle it through addition, and then continue to dismantle it to the lowest level, such as For a certain product, we then perform a multiplication of the product to find out why the GMV of this product has dropped, whether the traffic has dropped or the conversion rate has dropped, etc. The specific approach needs to be combined with different actual business needs, as well as considerations such as timeliness and development costs.
In the current scenario of NetEase Yanxuan, considering the versatility and business status, as a brand e-commerce company, when selling through external channels, factors such as traffic and conversion rate are important to us. It is a black box, so in our business scenarios, we mainly focus on additive disassembly.
The above is the detailed content of How does NetEase detect and diagnose abnormal data indicators?. For more information, please follow other related articles on the PHP Chinese website!

 Convert Text Documents to a TF-IDF Matrix with tfidfvectorizerApr 18, 2025 am 10:26 AM
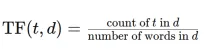
This article explains the Term Frequency-Inverse Document Frequency (TF-IDF) technique, a crucial tool in Natural Language Processing (NLP) for analyzing textual data. TF-IDF surpasses the limitations of basic bag-of-words approaches by weighting te
 Building Smart AI Agents with LangChain: A Practical GuideApr 18, 2025 am 10:18 AM
Unleash the Power of AI Agents with LangChain: A Beginner's Guide Imagine showing your grandmother the wonders of artificial intelligence by letting her chat with ChatGPT – the excitement on her face as the AI effortlessly engages in conversation! Th
 Mistral Large 2: Powerful Enough to Challenge Llama 3.1 405B?Apr 18, 2025 am 10:16 AM
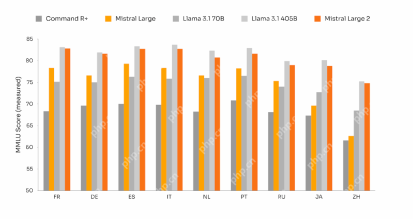
Mistral Large 2: A Deep Dive into Mistral AI's Powerful Open-Source LLM Meta AI's recent release of the Llama 3.1 family of models was quickly followed by Mistral AI's unveiling of its largest model to date: Mistral Large 2. This 123-billion paramet
 What is Noise Schedules in Stable Diffusion? - Analytics VidhyaApr 18, 2025 am 10:15 AM
Understanding Noise Schedules in Diffusion Models: A Comprehensive Guide Have you ever been captivated by the stunning visuals of digital art generated by AI and wondered about the underlying mechanics? A key element is the "noise schedule,&quo
 How to Build a Conversational Chatbot with GPT-4o? - Analytics VidhyaApr 18, 2025 am 10:06 AM
Building a Contextual Chatbot with GPT-4o: A Comprehensive Guide In the rapidly evolving landscape of AI and NLP, chatbots have become indispensable tools for developers and organizations. A key aspect of creating truly engaging and intelligent chat
 Top 7 Frameworks for Building AI Agents in 2025Apr 18, 2025 am 10:00 AM
This article explores seven leading frameworks for building AI agents – autonomous software entities that perceive, decide, and act to achieve goals. These agents, surpassing traditional reinforcement learning, leverage advanced planning and reasoni
 What's the Difference Between Type I and Type II Errors ? - Analytics VidhyaApr 18, 2025 am 09:48 AM
Understanding Type I and Type II Errors in Statistical Hypothesis Testing Imagine a clinical trial testing a new blood pressure medication. The trial concludes the drug significantly lowers blood pressure, but in reality, it doesn't. This is a Type
 Automated Text Summarization with Sumy LibraryApr 18, 2025 am 09:37 AM
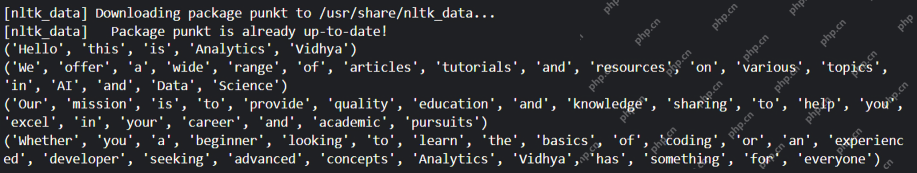
Sumy: Your AI-Powered Summarization Assistant Tired of sifting through endless documents? Sumy, a powerful Python library, offers a streamlined solution for automatic text summarization. This article explores Sumy's capabilities, guiding you throug


Hot AI Tools

Undresser.AI Undress
AI-powered app for creating realistic nude photos

AI Clothes Remover
Online AI tool for removing clothes from photos.

Undress AI Tool
Undress images for free

Clothoff.io
AI clothes remover

AI Hentai Generator
Generate AI Hentai for free.

Hot Article
Hot Tools

MinGW - Minimalist GNU for Windows
This project is in the process of being migrated to osdn.net/projects/mingw, you can continue to follow us there. MinGW: A native Windows port of the GNU Compiler Collection (GCC), freely distributable import libraries and header files for building native Windows applications; includes extensions to the MSVC runtime to support C99 functionality. All MinGW software can run on 64-bit Windows platforms.

SublimeText3 English version
Recommended: Win version, supports code prompts!

SublimeText3 Chinese version
Chinese version, very easy to use

SAP NetWeaver Server Adapter for Eclipse
Integrate Eclipse with SAP NetWeaver application server.

PhpStorm Mac version
The latest (2018.2.1) professional PHP integrated development tool

