

 Backend DevelopmentPython TutorialPython-matplotlib | Draw dual y-axis graphics (legend settings)

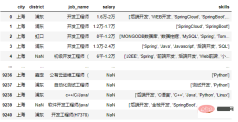
df = pd.read_csv('jobdata.csv')
colors = ["#51C1C8", "#536D84","#E96279"]
plt.figure(figsize=(16, 8))
ax1 = plt.subplot(111)
ax1.set_ylim(0,1200)
lin0 = ax1.plot(x_data, y_data1, marker='o', color=colors[0], label='岗位数量')
for x, y in enumerate(y_data1):
    plt.text(x - 0.2, y+5, y)
ax1.set_ylabel('岗位数量',fontsize=12)
plt.legend()
plt.title("各城市Java岗位数量")
plt.show()
# 增加y轴
ax2 = ax1.twinx()

ax2.set_ylim(0,60)
lin1 = ax2.plot(x_data, y_data2, linestyle='--', marker='o', c=colors[1], label='平均最低薪资')
for x, y in enumerate(y_data2):
    plt.text(x - 0.1, y+1, y)
lin2 = ax2.plot(x_data, y_data3, linestyle='--', marker='o', c=colors[2], label='平均最高薪资')
for x, y in enumerate(y_data3):
    plt.text(x - 0.1, y+1, y)
ax2.set_ylabel('平均薪资(万/年)',fontsize=12)
plt.legend()
plt.title("各城市Java岗位数量和薪资水平状况")
plt.show()3. 单独设置图例
ax1.legend(loc='best')
ax2.legend(loc='best')

ax1.legend(loc=2)
ax2.legend(loc=1)

这样看就比较直观了,但是我就想把三个图例放一起不可以吗?
当然可以!
3. 设置组合图例
lines = lin0+lin1+lin2
labs = [label.get_label() for label in lines]
plt.legend(lines,labs)

大功告成!
但是!如果是柱状图+折线图的情况,效果还一样吗?
但是!如果是柱状图+折线图的情况,效果还一样吗?
但是!如果是柱状图+折线图的情况,效果还一样吗?
1. 修改岗位数量为柱状图
plt.figure(figsize=(16, 8))
a1 = plt.subplot(111)
a1.set_ylim(0,1200)
bar = a1.bar(x_data, y_data1, color=colors[0], label='岗位数量')
for x, y in enumerate(y_data1):
    plt.text(x - 0.2, y+5, y)
a1.set_ylabel('岗位数量',fontsize=12)

...

lines = bar+lin1+lin2
labs = [label.get_label() for label in lines]
plt.legend(lines,labs)
直接报错了!


The prompt type is inconsistent. It is obviously a problem with the type of bar and line. Let’s check the source code:
matplotlib.axes.Axes.plot:

matplotlib.axes.Axes.bar:

2. 设置Line2D和patches的组合图例
legend_handles = [
    Line2D([], [], linewidth=1, ls='--', lw=2, c=colors[2], label='平均最高薪资'),
    Line2D([], [], linewidth=1, lw=2, c=colors[1], label='平均最低薪资'),
    patches.Rectangle((0, 0), 1, 1, facecolor=colors[0],label='岗位数量')
]
plt.legend(handles=legend_handles, loc='best', fontsize=14)
The above is the detailed content of Python-matplotlib | Draw dual y-axis graphics (legend settings). For more information, please follow other related articles on the PHP Chinese website!

 How do you slice a Python list?May 02, 2025 am 12:14 AM
SlicingaPythonlistisdoneusingthesyntaxlist[start:stop:step].Here'showitworks:1)Startistheindexofthefirstelementtoinclude.2)Stopistheindexofthefirstelementtoexclude.3)Stepistheincrementbetweenelements.It'susefulforextractingportionsoflistsandcanuseneg
 What are some common operations that can be performed on NumPy arrays?May 02, 2025 am 12:09 AM
NumPyallowsforvariousoperationsonarrays:1)Basicarithmeticlikeaddition,subtraction,multiplication,anddivision;2)Advancedoperationssuchasmatrixmultiplication;3)Element-wiseoperationswithoutexplicitloops;4)Arrayindexingandslicingfordatamanipulation;5)Ag
 How are arrays used in data analysis with Python?May 02, 2025 am 12:09 AM
ArraysinPython,particularlythroughNumPyandPandas,areessentialfordataanalysis,offeringspeedandefficiency.1)NumPyarraysenableefficienthandlingoflargedatasetsandcomplexoperationslikemovingaverages.2)PandasextendsNumPy'scapabilitieswithDataFramesforstruc
 How does the memory footprint of a list compare to the memory footprint of an array in Python?May 02, 2025 am 12:08 AM
ListsandNumPyarraysinPythonhavedifferentmemoryfootprints:listsaremoreflexiblebutlessmemory-efficient,whileNumPyarraysareoptimizedfornumericaldata.1)Listsstorereferencestoobjects,withoverheadaround64byteson64-bitsystems.2)NumPyarraysstoredatacontiguou
 How do you handle environment-specific configurations when deploying executable Python scripts?May 02, 2025 am 12:07 AM
ToensurePythonscriptsbehavecorrectlyacrossdevelopment,staging,andproduction,usethesestrategies:1)Environmentvariablesforsimplesettings,2)Configurationfilesforcomplexsetups,and3)Dynamicloadingforadaptability.Eachmethodoffersuniquebenefitsandrequiresca
 How do you slice a Python array?May 01, 2025 am 12:18 AM
The basic syntax for Python list slicing is list[start:stop:step]. 1.start is the first element index included, 2.stop is the first element index excluded, and 3.step determines the step size between elements. Slices are not only used to extract data, but also to modify and invert lists.
 Under what circumstances might lists perform better than arrays?May 01, 2025 am 12:06 AM
Listsoutperformarraysin:1)dynamicsizingandfrequentinsertions/deletions,2)storingheterogeneousdata,and3)memoryefficiencyforsparsedata,butmayhaveslightperformancecostsincertainoperations.
 How can you convert a Python array to a Python list?May 01, 2025 am 12:05 AM
ToconvertaPythonarraytoalist,usethelist()constructororageneratorexpression.1)Importthearraymoduleandcreateanarray.2)Uselist(arr)or[xforxinarr]toconvertittoalist,consideringperformanceandmemoryefficiencyforlargedatasets.


Hot AI Tools

Undresser.AI Undress
AI-powered app for creating realistic nude photos

AI Clothes Remover
Online AI tool for removing clothes from photos.

Undress AI Tool
Undress images for free

Clothoff.io
AI clothes remover

Video Face Swap
Swap faces in any video effortlessly with our completely free AI face swap tool!

Hot Article
Hot Tools

SAP NetWeaver Server Adapter for Eclipse
Integrate Eclipse with SAP NetWeaver application server.

MinGW - Minimalist GNU for Windows
This project is in the process of being migrated to osdn.net/projects/mingw, you can continue to follow us there. MinGW: A native Windows port of the GNU Compiler Collection (GCC), freely distributable import libraries and header files for building native Windows applications; includes extensions to the MSVC runtime to support C99 functionality. All MinGW software can run on 64-bit Windows platforms.

SecLists
SecLists is the ultimate security tester's companion. It is a collection of various types of lists that are frequently used during security assessments, all in one place. SecLists helps make security testing more efficient and productive by conveniently providing all the lists a security tester might need. List types include usernames, passwords, URLs, fuzzing payloads, sensitive data patterns, web shells, and more. The tester can simply pull this repository onto a new test machine and he will have access to every type of list he needs.

Notepad++7.3.1
Easy-to-use and free code editor

ZendStudio 13.5.1 Mac
Powerful PHP integrated development environment

