
Home >Backend Development >Golang >For golang performance diagnosis, it is enough to read this article
For golang performance diagnosis, it is enough to read this article
- Go语言进阶学习forward
- 2023-07-24 16:18:331906browse
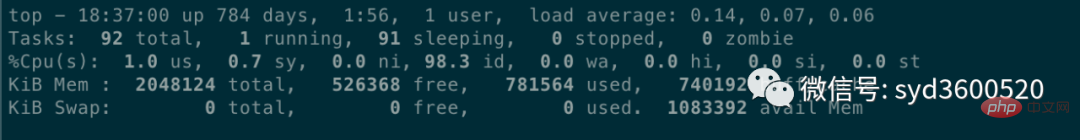 Average load: 0.14 0.07 0.06 represents the average machine load in the past 1 minute, 5 minutes, and 15 minutes respectively. According to experience, if the load value is less than 0.7*CPU The number is normal. If it exceeds or reaches four or five times the number of CPU cores, the system load will be obviously high.
CPU context switching can be viewed
vmstat command. The scenarios in which context switching occurs are as follows: Type:
- The time slice is used up, the CPU normally schedules the next task
- is Other tasks with higher priority are preempted
- When the execution task encounters I/O blocking, the current task is suspended and switched to the next task
- The user code actively suspends the current task to give up the CPU
- Multi-tasking seizes resources because it is not available And was suspended
Hardware Interrupt
##1.2 Memory
iostat, and you can see whether the disk I/O is normal through the CPU's I/O wait. If the disk I/O is always in a high state, it means that the disk is too slow or faulty and has become a performance bottleneck. Application optimization or disk replacement is required.
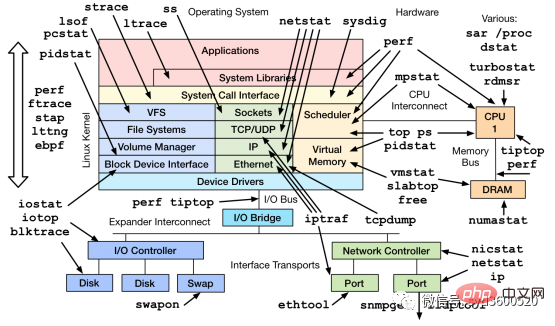
In addition to the commonly used commands such as top, ps, vmstat, iostat, etc., there are other Linux tools that can diagnose system problems, such as mpstat, tcpdump, netstat, pidstat, sar and other Linux performance diagnostic tools as shown below:
- Tracing A method of instrumenting code to analyze latency throughout the life cycle of a call or user request, and can span multiple Go processes.
2.1 profiling
1. First profiling code is buried in
import _ "net/http/pprof"


func main() {
    go func() {
        log.Println(http.ListenAndServe("0.0.0.0:9090", nil))
    }()
    ...
}
2. Save the profile at a specific point in time, such as saving heap information
curl http://localhost:6060/debug/pprof/heap --output heap.tar.gz
3. Use go tool pprof to analyze the saved profile snapshot, such as analyzing the above heap information
go tool pprof heap.tar.gz
#2.1. 1 CPU Profiling
CThe problem of excessive PU usage
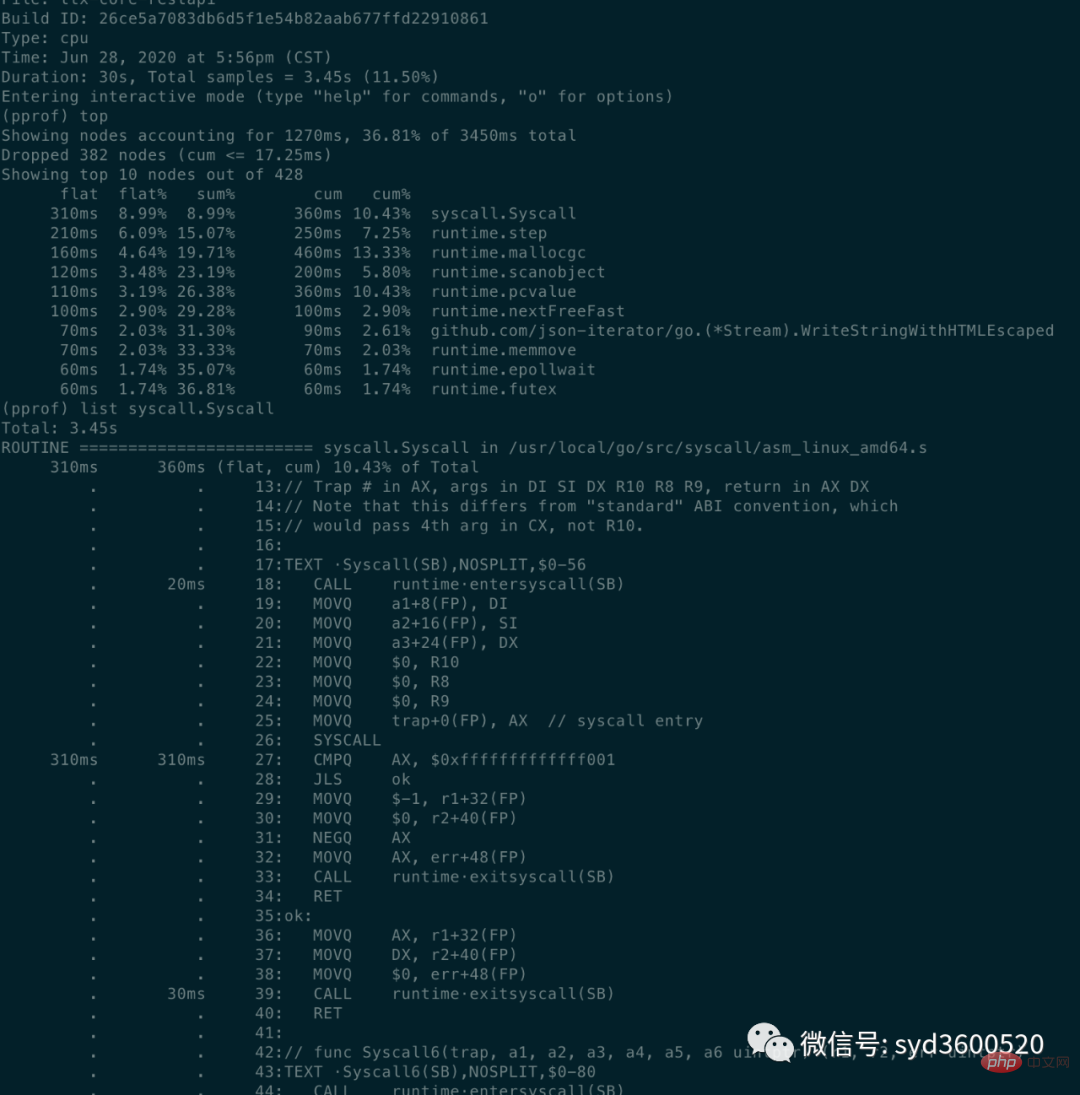
go tool pprof http://localhost:6060/debug/pprof/profile?second=10Command line mode: Common command top list tracestop: View the top 10 function information sorted by memory or CPU usage
- flat: The CPU time occupied by the current function (
excluding other functions it calls)
- flat% : The percentage of CPU used by the current function to the total CPU time
- sum%: The sum of the flat percentages of each previous line
- cum: The cumulative amount, How long the current function and its sub-functions occupy the CPU
- cum%: The cumulative amount accounts for the percentage of the total amount
cum>=flat
list: 查看某个函数的代码 以及该函数每行代码的指标信息
traces:打印所有函数调用栈 以及调用栈的指标信息
UI界面方式:从服务器download下生成的sample文件
go tool pprof -http=:8080 pprof.xxx.samples.cpu.001.pb.gz
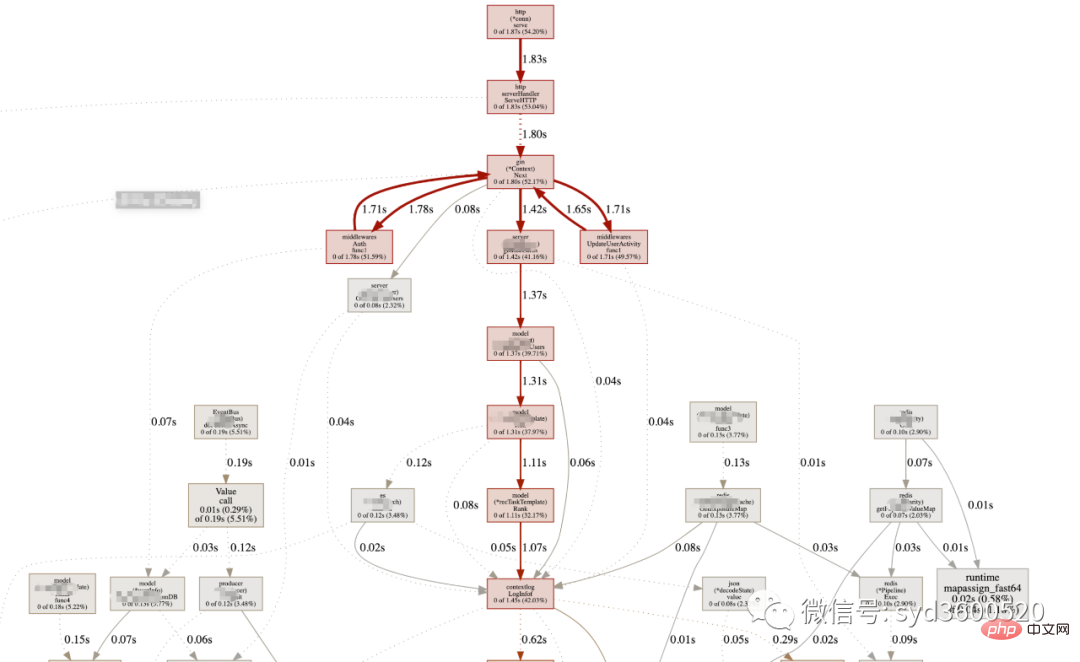
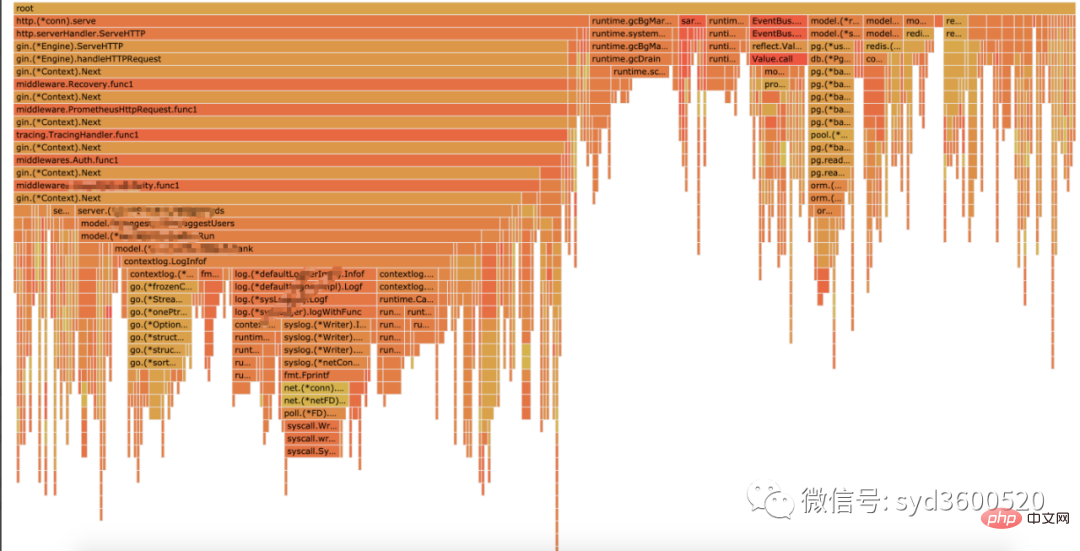
Flame graph很清晰得可以看到当前CPU被哪些函数执行栈占用
1.2 Heap Profiling
go tool pprof http://localhost:6060/debug/pprof/heap?second=10
命令行 UI查看方式 同理
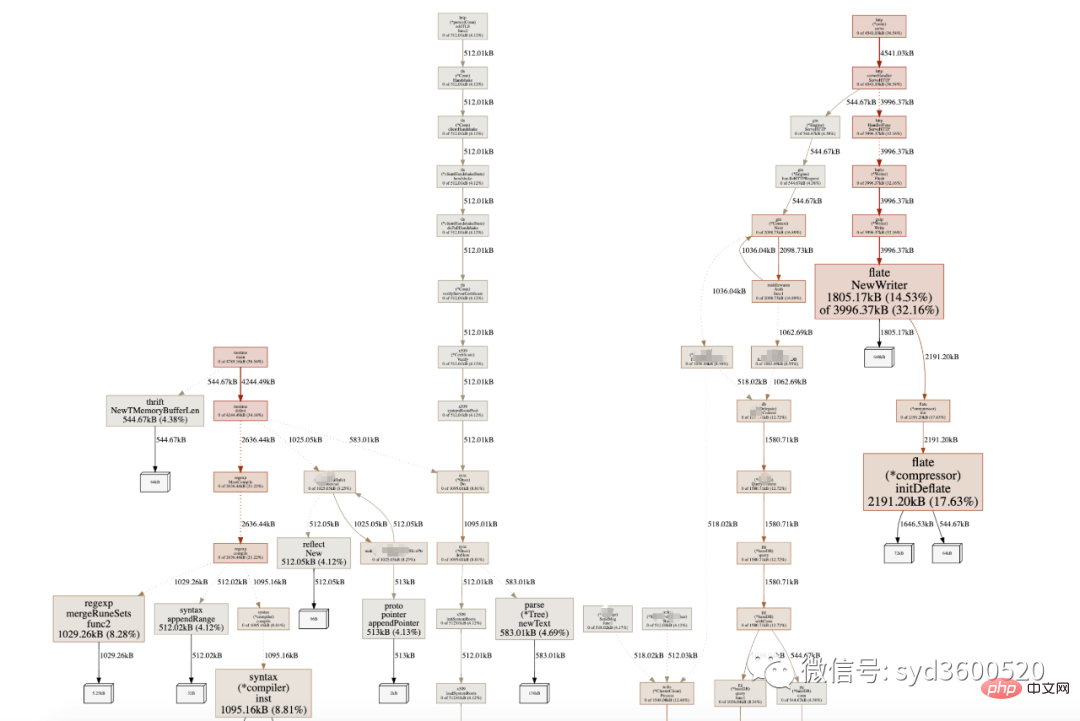
graph中方框越大 占用内存越多 火焰图 宽度越大 占用内存越多
SAMPLE->inuse_objects可以查看当前的对象数量 这个参数对于分析gc线程占用较高cpu时很有用处 它侧重查看对象数量
inuse_space图可以查看具体的内存占用
毕竟对于10个100m的对象和1亿个10字节的对象占用内存几乎一样大,但是回收起来一亿个小对象肯定比10个大对象要慢很多。
go tool pprof -inuse_space http://localhost:6060/debug/pprof/heap : 分析应用程序的常驻内存占用情况 (默认)
go tool pprof -alloc_objects http://localhost:6060/debug/pprof/heap: 分析应用程序的内存临时分配情况
1.3 并发请求问题 查看方式跟上面类似。
go tool pprof http://localhost:6060/debug/pprof/goroutine
go tool pprof http://localhost:6060/debug/pprof/block
go tool pprof http://localhost:6060/debug/pprof/mutex
2.2 tracing
trace并不是万能的,它更侧重于记录分析 采样时间内运行时系统具体干了什么。
收集trace数据的三种方式:
1. 使用runtime/trace包 调用trace.Start()和trace.Stop()
2. 使用go test -trace=28897b20adb25fbae118a3f80f538dec测试标识
3. 使用debug/pprof/trace handler 获取运行时系统最好的方法
例如,通过
go tool pprof http://localhost:6060/debug/pprof/trace?seconds=20 > trace.out
获取运行时服务的trace信息,使用
go tool trace trace.out
会自动打开浏览器展示出UI界面
其中trace view 只能使用chrome浏览器查看,这里go截止1.14版本存在一个 bug,解决办法如下:
go tool trace trace.out 无法查看trace view
go bug:https://github.com/golang/go/issues/25151
mac 解决版本:安装gotip
go get golang.org/dl/gotip
gotip download
then  使用 gotip tool trace trace.out即可
获取的trace.out 二进制文件也可以转化为pprof格式的文件
go tool trace -pprof=TYPE trace.out > TYPE.pprof
Tips:生成的profile文件 支持 network profiling、synchronization profiling、syscall profiling、scheduler profiling
go tool pprof TYPE.pprof
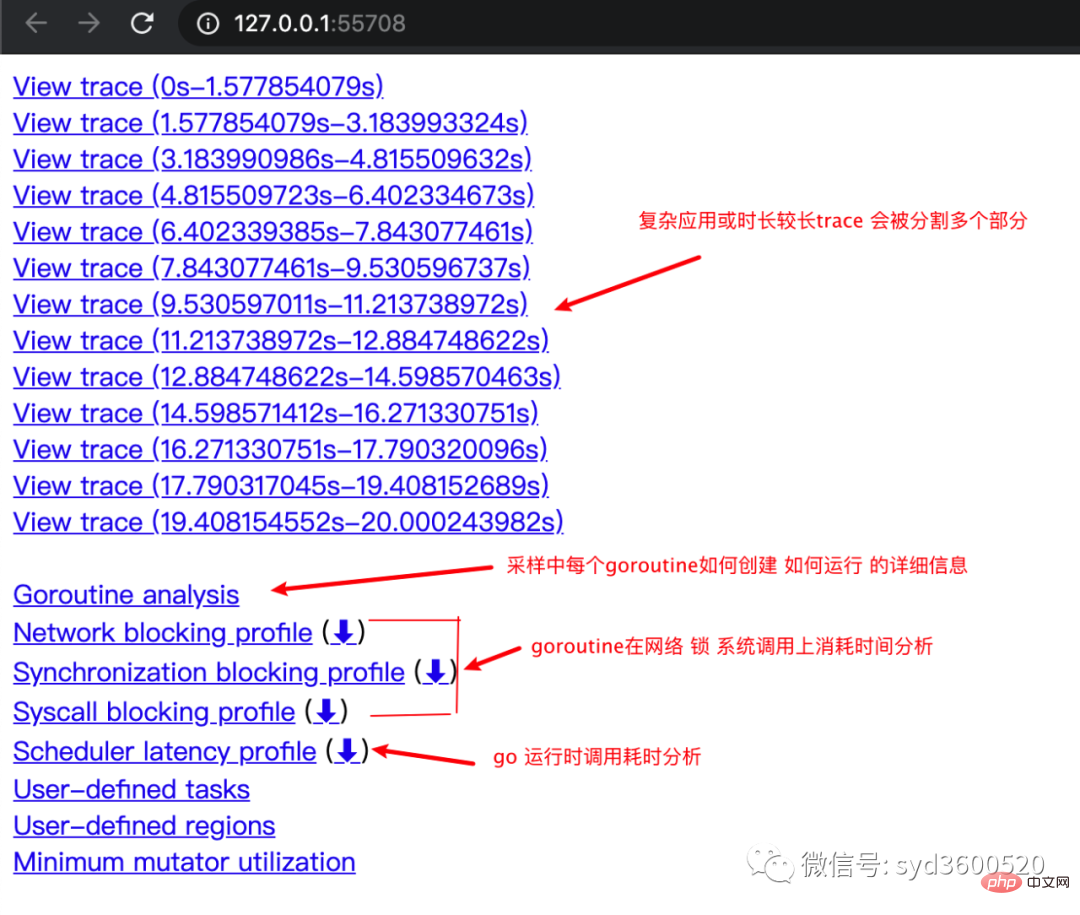
使用gotip tool trace trace.out可以查看到trace view的丰富操作界面:
操作技巧:
ctrl + 1 选择信息
ctrl + 2 移动选区
ctrl + 3 放大选区
ctrl + 4 指定选区区间
shift + ? 帮助信息
AWSD跟游戏快捷键类似 玩起来跟顺手
整体的控制台信息 如下图:
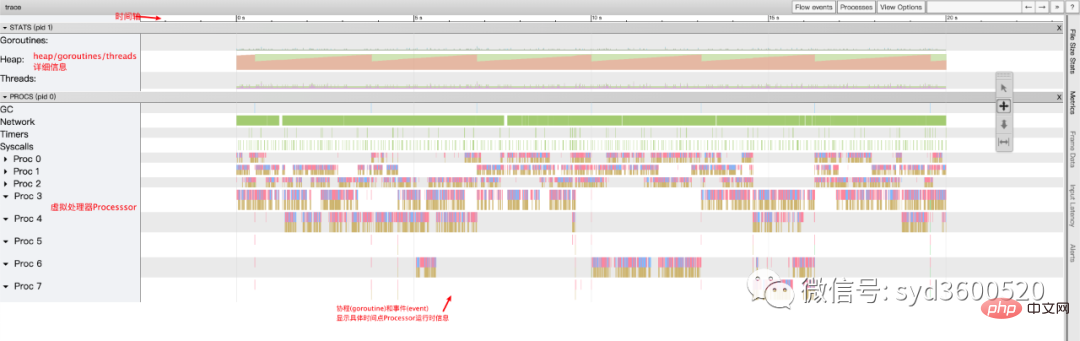
时间线: 显示执行的时间单元 根据时间的纬度不同 可以调整区间
堆: 显示执行期间内存的分配和释放情况
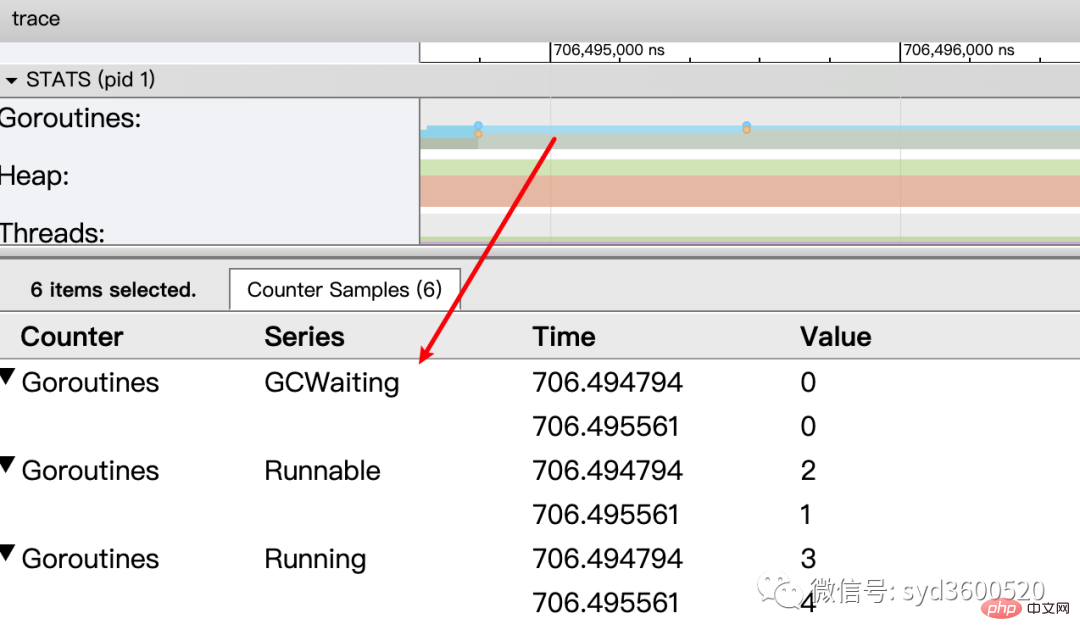
协程(Goroutine): 显示每个时间点哪些Goroutine在运行 哪些goroutine等待调度 ,其包含 GC 等待(GCWaiting)、可运行(Runnable)、运行中(Running)这三种状态。
goroutine区域选中时间区间
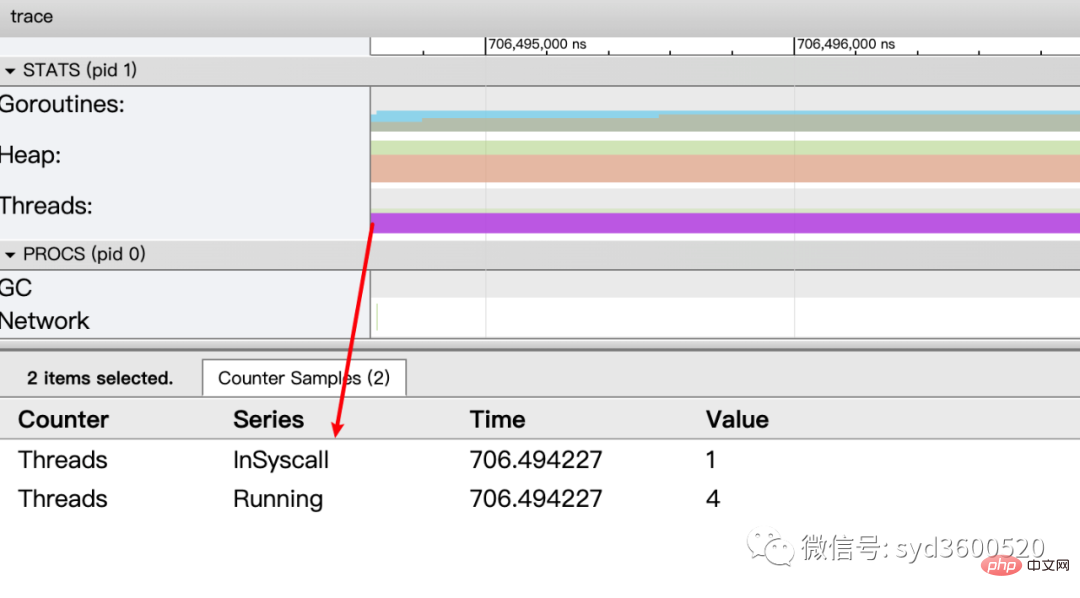
OS线程(Machine): 显示在执行期间有多少个线程在运行,其包含正在调用 Syscall(InSyscall)、运行中(Running)这两种状态。
虚拟处理器Processor: 每个虚拟处理器显示一行,虚拟处理器的数量一般默认为系统内核数。数量由环境变量GOMAXPROCS控制
协程和事件: 显示在每个虚拟处理器上有什么 Goroutine 正在运行,而连线行为代表事件关联。
每个Processor分两层,上一层表示Processor上运行的goroutine的信息,下一层表示processor附加的事件比如SysCall 或runtime system events
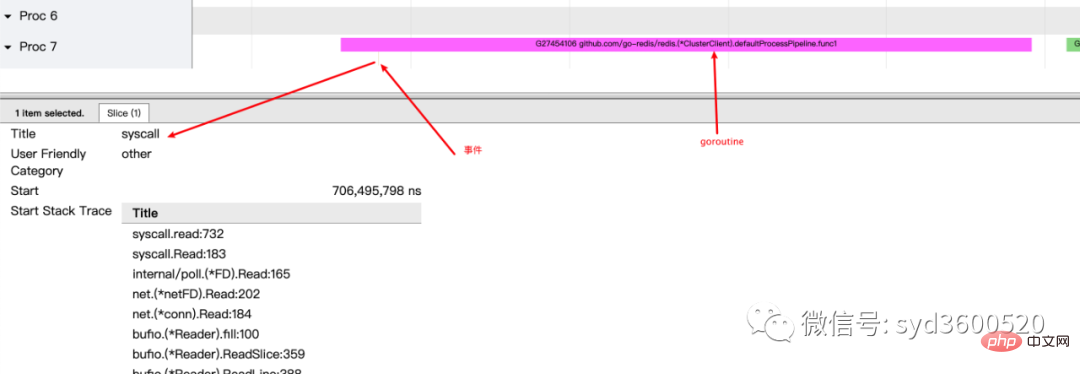
ctrl+3 放大选区,选中goroutine 可以查看,特定时间点 特定goroutine的执行堆栈信息以及关联的事件信息
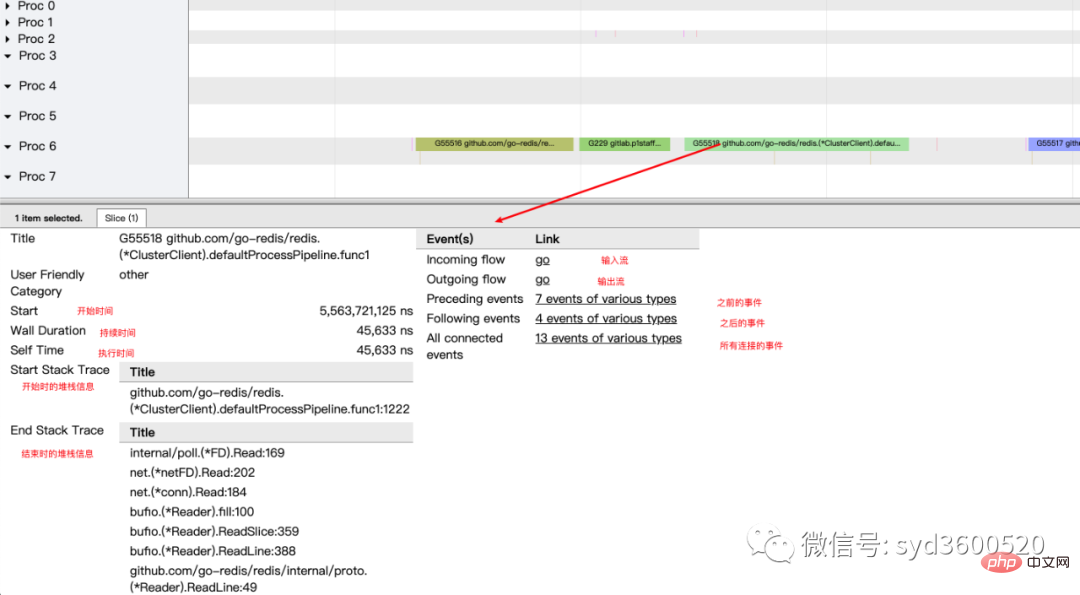
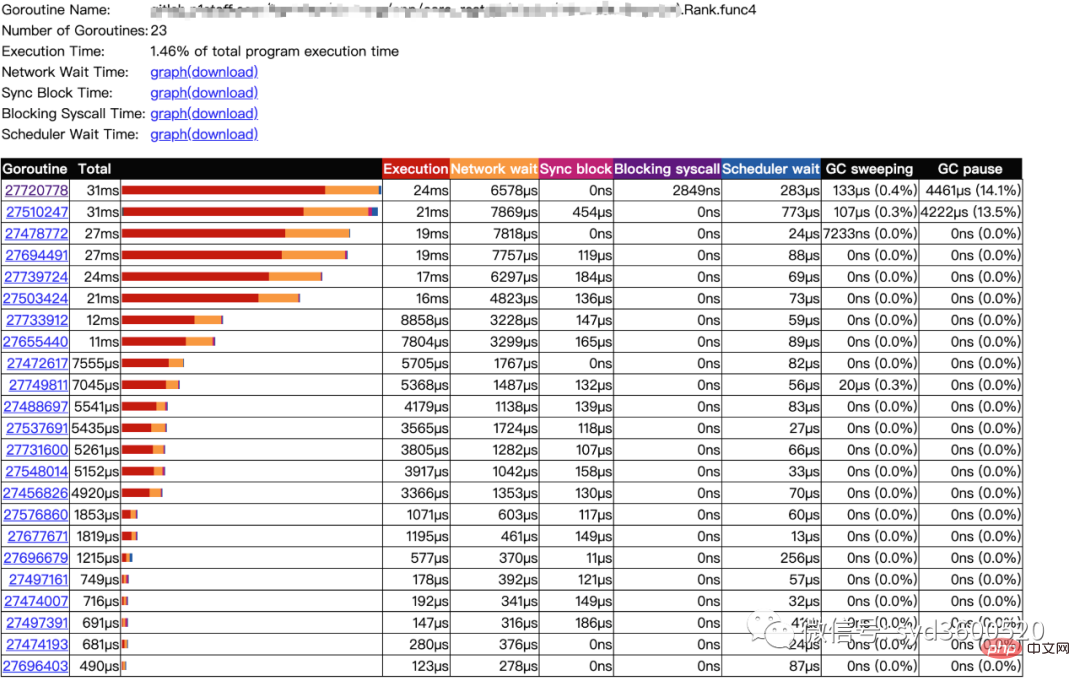
goroutine analysis
点击goroutine的id 可以跳到trace view 详细查看goroutine具体干了什么
| 名称 |
含义 |
| Execution | 执行时间 |
| Network wait | 网络等待时间 |
| Sync Block | 同步阻塞时间 |
| Blocking syscall | 系统调用阻塞时间 |
| Scheduler wait | 调度等待时间 |
| GC Sweeping | GC清扫时间 |
| GC Pause | GC暂停时间 |
实践 一个延迟问题诊断
当我们一个执行关键任务的协程从运行中被阻塞。这里可能的原因:被syscall阻塞 、阻塞在共享内存(channel/mutex etc)、阻塞在运行时(如 GC)、甚至有可能是运行时调度器不工作导致的。这种问题使用pprof很难排查,
使用trace只要我们确定了时间范围就可以在proc区域很容易找到问题的源头
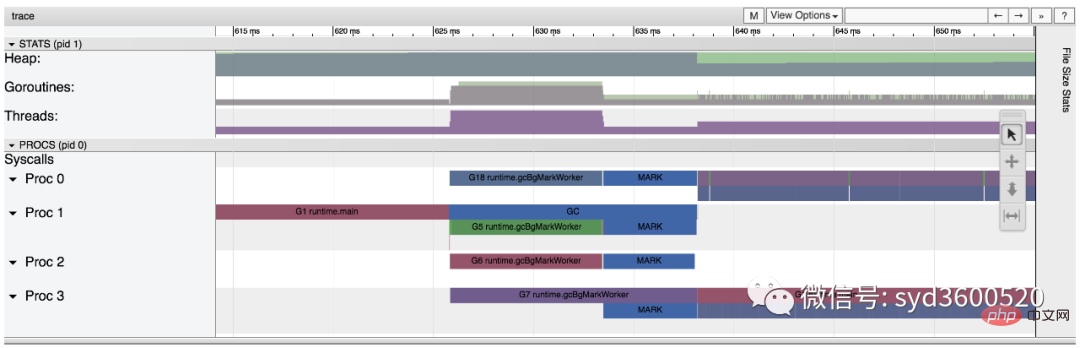
上图可见,GC 的MARK阶段阻塞了主协程的运行
2.3 GC
初始所有对象都是白色
Stack scan阶段:从root出发扫描所有可达对象,标记为灰色并放入待处理队列;root包括全局指针和goroutine栈上的指针
Mark阶段:1.从待处理队列取出灰色对象,将其引用的对象标记为灰色并放入队列,自身标记为黑色 2. re-scan全局指针和栈,因为mark和用户程序并行运行,故过程1的时候可能会有新的对象分配,这时需要通过写屏障(write barrier)记录下来;re-scan再完成检查;
重复步骤Mark阶段,直到灰色对象队列为空,执行清扫工作(白色即为垃圾对象)
GC即将开始时,需要STW 做一些准备工作, 如enable write barrier
re-scan也需要STW,否则上面Mark阶段的re-scan无法终止
通过GODEBUG=gctrace=1可以开启gc日志,查看gc的结果信息
$ GODEBUG=gctrace=1 go run main.go
gc 1 @0.001s 19%: 0.014+3.7+0.015 ms clock, 0.11+2.8/5.7/3.2+0.12 ms cpu, 5->6->6 MB, 6 MB goal, 8 P
gc 2 @0.024s 6%: 0.004+3.4+0.010 ms clock, 0.032+1.4/4.5/5.3+0.085 ms cpu, 13->14->13 MB, 14 MB goal, 8 P
gc 3 @0.093s 3%: 0.004+6.1+0.027 ms clock, 0.032+0.19/11/15+0.22 ms cpu, 24->25->22 MB, 26 MB goal, 8 P
scvg: 0 MB released
scvg: inuse: 4, idle: 58, sys: 63, released: 58, consumed: 4 (MB)
scvg: 0 MB released
scvg: inuse: 4, idle: 58, sys: 63, released: 58, consumed: 4 (MB)
scvg: 0 MB released
scvg: inuse: 4, idle: 58, sys: 63, released: 58, consumed: 4 (MB)
scvg: 0 MB released
scvg: inuse: 4, idle: 58, sys: 63, released: 58, consumed: 4 (MB)
格式
gc # @#s #%: #+#+# ms clock, #+#/#/#+# ms cpu, #->#-># MB, # MB goal, # P
含义
gc#:GC 执行次数的编号,每次叠加。
@#s:自程序启动后到当前的具体秒数。
#%:自程序启动以来在GC中花费的时间百分比。
#+...+#:GC 的标记工作共使用的 CPU 时间占总 CPU 时间的百分比。
#->#-># MB:分别表示 GC 启动时, GC 结束时, GC 活动时的堆大小.
#MB goal:下一次触发 GC 的内存占用阈值。
#P:当前使用的处理器 P 的数量。
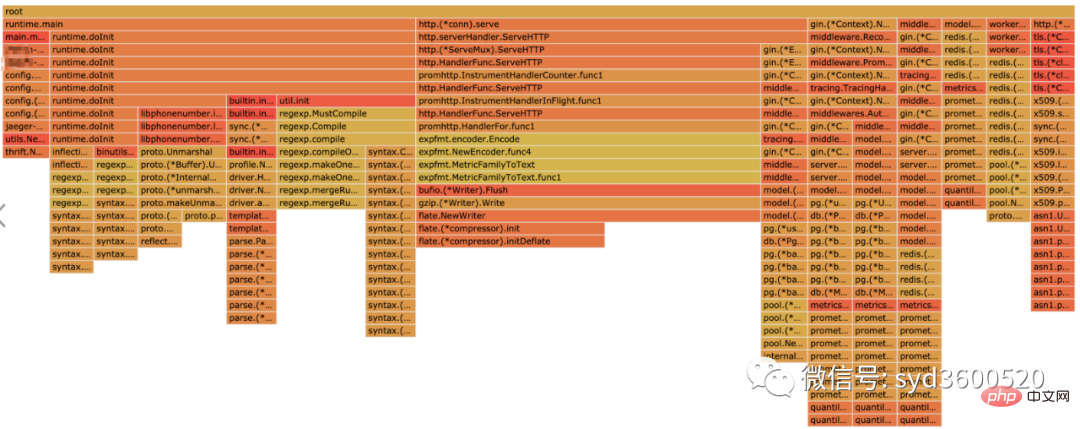
https://github.com/felixge/fgprof 给出了一个解决方案:
具体用法:
package main
import(
_ "net/http/pprof"
"github.com/felixge/fgprof"
)
func main() {
http.DefaultServeMux.Handle("/debug/fgprof", fgprof.Handler())
go func() {
log.Println(http.ListenAndServe(":6060", nil))
}()
// <code to profile>
}
git clone https://github.com/brendangregg/FlameGraph
cd FlameGraph
curl -s 'localhost:6060/debug/fgprof?seconds=3' > fgprof.fold
./flamegraph.pl fgprof.fold > fgprof.svg如果遇到这种CPU消耗型和非CPU消耗型混合的情况下 可以试试排查下。
The above is the detailed content of For golang performance diagnosis, it is enough to read this article. For more information, please follow other related articles on the PHP Chinese website!