Home >Database >Mysql Tutorial >What is the monitoring method of MySQL database?
What is the monitoring method of MySQL database?
- WBOYWBOYWBOYWBOYWBOYWBOYWBOYWBOYWBOYWBOYWBOYWBOYWBforward
- 2023-06-03 13:22:131441browse
There are many ways to monitor current databases, which are divided into three categories: built-in database, commercial, and open source. Each has its own characteristics;
As for the mysql database, because of its high Community activity and monitoring methods are diverse. No matter which monitoring method is used, the core is monitoring data. After obtaining comprehensive monitoring data, it is a flexible display part.
1. Number of connections (Connects)
1.1. Maximum number of used connections
show status like 'Max_used_connections';
1.2. Number of currently open connections
show status like 'Threads_connected';
2. Cache ( bufferCache)
2.1. Number of times not read from the buffer pool
show status like 'Innodb_buffer_pool_reads';
2.2. Number of times read from the buffer pool
show status like 'Innodb_buffer_pool_read_requests';
2.3. Total number of pages in the buffer pool
show status like 'Innodb_buffer_pool_pages_total';
2.4, Number of free pages in the buffer pool
show status like 'Innodb_buffer_pool_pages_free';
2.5, Cache hit rate calculation
(1-Innodb_buffer_pool_reads/Innodb_buffer_pool_read_requests)*100%
2.6, Cache pool usage rate
((Innodb_buffer_pool_pages_total-Innodb_buffer_pool_pages_free)/Innodb_buffer_pool_pages_total)*100%
3, Lock(lock)
Note: The number of lock waiting statistics is cumulative data. Each time it is obtained, it can be subtracted from the previous data to obtain the current statistical data
3.1. Lock waiting Number
show status like 'Innodb_row_lock_waits';
3.2. Average waiting time for each lock
show status like 'Innodb_row_lock_time_avg';
3.3. Check whether there is a table lock. If there is data, it means there is a lock table. If it is empty, it means there is no table lock
show open TABLES where in_use>0
4. Slow SQL
Note: When the mysqldumpslow command fails to execute, the slow log will be synchronized to the local for formatting.
4.1. Check whether the mysql slow sql switch is turned on
show variables like 'slow_query_log'; --ON 为开启状态,OFF 为关闭状态

set global slow_query_log=1 -- 可进行开启
4.2. Check the mysql slow sql threshold
show variables like 'long_query_time';

set global long_query_time=0.1 -- 根据页面传递阈值参数,修改阈值
4.3. Check the mysql slow sql directory
show variables like 'slow_query_log_file';
4.4. Format slow sql log
Note: This statement cannot be executed through jdbc and belongs to command line execution.
means: display the execution information of the 10 longest SQL statements. 10 can be modified to the TOP number. The information displayed is: number of executions, average execution time, SQL statement
mysqldumpslow -s at -t 10 /export/data/mysql/log/slow.log
5, statement
5.1, insert number
show status like 'Com_insert';
5.2, delete number
show status like 'Com_delete';
5.3, update quantity
show status like 'Com_update';
5.4, select quantity
show status like 'Com_select';
6, throughput (Database throughputs)
6.1, send throughput
show status like 'Bytes_sent';
6.2 , receiving throughput
show status like 'Bytes_received';
6.3, total throughput
Bytes_sent+Bytes_received
7, database parameters (serverconfig)
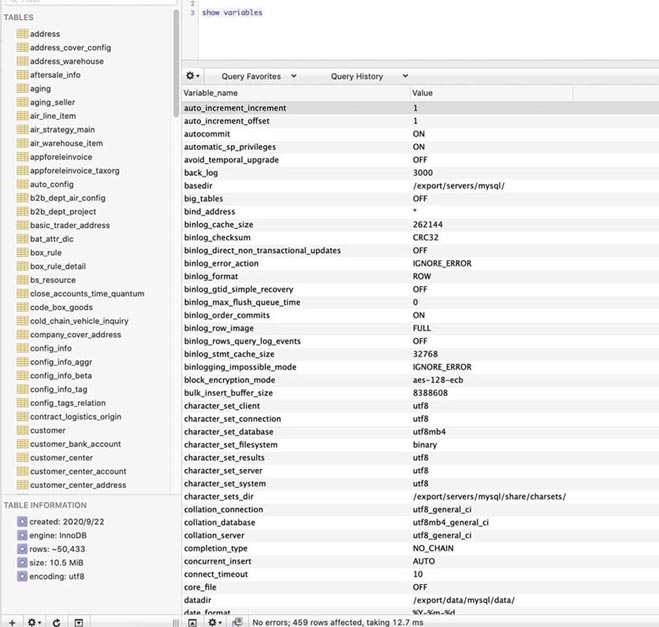
7.1, show variables

8. Slow SQL troubleshooting steps
Slow SQL refers to MySQL slow query, specifically refers to SQL whose running time exceeds the long_query_time value.
We often hear that MySQL has binary log binlog, relay log relaylog, redo rollback log redolog, undolog, etc. For slow queries, there is also a slow query log, slowlog, which is used to record statements whose response time exceeds the threshold in MySQL. Slow SQL has a fatal impact on actual production business. Therefore, it is particularly important for testers to monitor the execution of database SQL statements during the performance test process and provide accurate performance optimization suggestions for development. Then how to use the slow query log provided by the Mysql database to monitor the execution of SQL statements and find the SQL statements with higher consumption. The following is a detailed description of the steps to use the slow query log:
8.1. Make sure the slow SQL switch slow_query_log is turned on.

8.2. Set the slow SQL domain value long_query_time
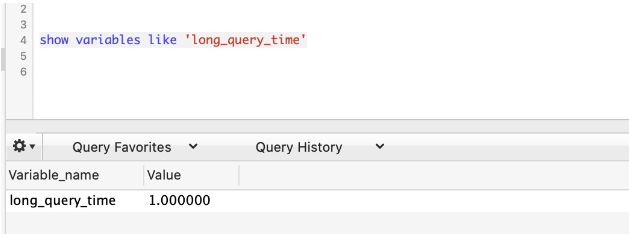
This long_query_time is used to define how many seconds slower is considered a "slow query". Note that the unit is Seconds, I set the value of long_query_time to 1 by executing the sql command set long_query_time=1, that is, any query that takes more than 1 second to execute is considered a slow query, as follows:

8.3. Check the slow SQL log path


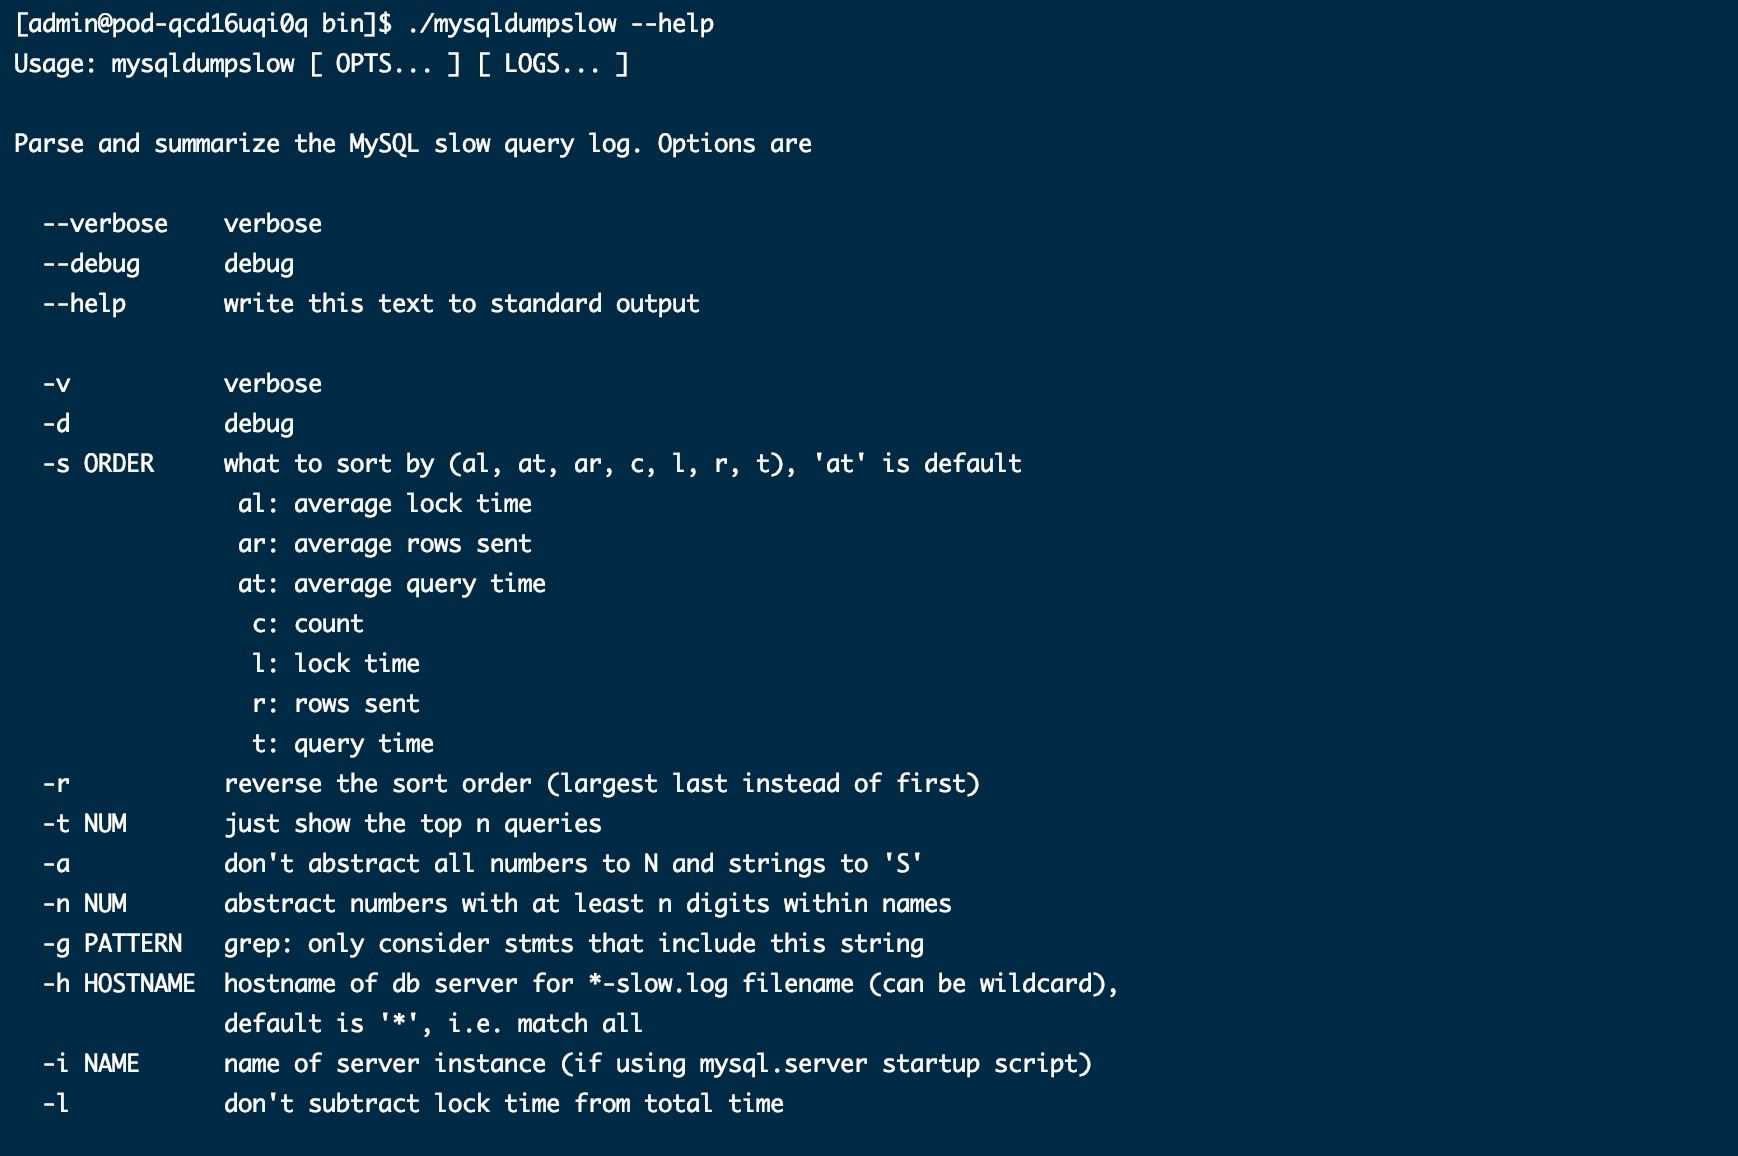
./mysqldumpslow -s c -t 10 /export/data/mysql/log/slow.logRetrieve the 3 slow queries with the slowest query time
./mysqldumpslow -s t -t 3 /export/data/mysql/log/slow.logNote: The analysis results using mysqldumpslow will not display the specific and complete sql statement, but only the structure of the sql;
If: SELECT FROM sms_send WHERE service_id=10 GROUP BY content LIMIT 0, 1000;
mysqldumpslow command is executed and displayed:
Count: 2 Time=1.5s (3s) Lock=0.00s (0s) Rows=1000.0 (2000) , vgos_dba[vgos_dba]@[10.130.229.196]SELECT FROM sms_send WHERE service_id=N GROUP BY content LIMIT N, N
- Count: Indicates the number of execution times of this type of statement. The above figure indicates that the select statement has been executed 2 times.
- Time: Indicates the average execution time (total time) of this type of statement
- Lock: Lock time 0s.
Rows:单次返回的结果数是 1000 条记录,2 次总共返回 2000 条记录。
通过这个工具就可以查询出来哪些 sql 语句是慢 SQL,从而反馈研发进行优化,比如加索引,该应用的实现方式等。
8.5、常见慢 SQL 排查
8.5.1、不使用子查询
SELECT FROM t1 WHERE id (SELECT id FROM t2 WHERE name='hechunyang');
子查询在 MySQL5.5 版本里,内部执行计划器是这样执行的:先查外表再匹配内表,而不是先查内表 t2,当外表的数据很大时,查询速度会非常慢。
在 MariaDB10/MySQL5.6 版本里,采用 join 关联方式对其进行了优化,这条 SQL 会自动转换为
SELECT t1. FROM t1 JOIN t2 ON t1.id = t2.id;
但请注意的是:优化只针对 SELECT 有效,对 UPDATE/DELETE 子 查询无效, 生产环境尽量应避免使用子查询。
8.5.2、避免函数索引
SELECT FROM t WHERE YEAR(d) >= 2016;
由于 MySQL 不像 Oracle 那样⽀持函数索引,即使 d 字段有索引,也会直接全表扫描。
应改为 :
SELECT FROM t WHERE d >= ‘2016-01-01';
8.5.3、用 IN 来替换 OR 低效查询
慢
SELECT FROM t WHERE LOC_ID = 10 OR LOC_ID = 20 OR LOC_ID = 30;
高效查询
SELECT FROM t WHERE LOC_IN IN (10,20,30);
8.5.4、LIKE 双百分号无法使用到索引
SELECT FROM t WHERE name LIKE '%de%';
应改为 :
SELECT FROM t WHERE name LIKE 'de%';
8.5.5、分组统计可以禁止排序
SELECT goods_id,count() FROM t GROUP BY goods_id;
默认情况下,MySQL 对所有 GROUP BY col1,col2… 的字段进⾏排序。如果查询包括 GROUP BY,想要避免排序结果的消耗,则可以指定 ORDER BY NULL 禁止排序。
应改为 :
SELECT goods_id,count () FROM t GROUP BY goods_id ORDER BY NULL;
8.5.6、禁止不必要的 ORDER BY 排序
SELECT count(1) FROM user u LEFT JOIN user_info i ON u.id = i.user_id WHERE 1 = 1 ORDER BY u.create_time DESC;
应改为 :
SELECT count (1) FROM user u LEFT JOIN user_info i ON u.id = i.user_id;
The above is the detailed content of What is the monitoring method of MySQL database?. For more information, please follow other related articles on the PHP Chinese website!

