


1. Rendering

2. Layer control
The folium official also provides some clearer methods for us to use. Just like layer control. The official method name is FeatureGroup, and the import method is from folium import FeatureGroup, or folium.FeatureGroup(). I won’t go into details about the specific principles here, but mainly look at the examples:
import folium
def map2png(map_data,out_file='pdf.png'):
# 1.直接构造,默认底图
mo = folium.Map(location=[0, 0])
# 2.图层1-高德底图+数据
fg = folium.FeatureGroup()
# 2.1 高德地图
fg.add_child(folium.TileLayer(
tiles='http://webrd02.is.autonavi.com/appmaptile?lang=zh_cn&size=1&scale=1&style=8&x={x}&y={y}&z={z}',
attr="© <a href=http://ditu.amap.com/>高德地图</a>",
min_zoom=0,
max_zoom=19,
control=True,
zoom_control=False,
show=True))
# 2.2添加一个点
fg.add_child(folium.Marker(
location=[45.3311, -121.7113],
popup="Timberline Lodge",
icon=folium.Icon(color="green")))
# 2.3添加一个线形
fg.add_child(folium.PolyLine(
locations=[[38.68,115.67],
[38.85,115.48],
[38.65,115.37],
[38.68,115.67]],
color='green', weight=2, opacity=1))
# 2.4添加一个面
fg.add_child(folium.Polygon(
locations=[[38.68,115.67],
[38.85,115.48],
[38.65,115.37],
[38.68,115.67]],
color='green', weight=2,
fill=True,fill_color = 'red'))
# 2.5将我们的图层加入map
mo.add_child(fg)
# 3.图层2-重点数据+最上层
fg2 = folium.FeatureGroup()
fg2.add_child(folium.Polygon(
locations=[[38.68,115.67],
[38.85,115.48],
[38.65,115.37],
[38.68,115.67]],
color='green', weight=2,
fill=True,fill_color = 'red'))
mo.add_child(fg2)
# 4.将图层fg2显示在最上层,keep_in_front的参数必须是FeatureGroup或TileLayer对象
mo.keep_in_front(fg2)
# 5.根据范围缩放地图
mo.fit_bounds([[38.68,115.67],
[38.85,115.48],
[38.65,115.37],
[38.68,115.67]])
root = mo.get_root()
html = root.render() # 这个拿到的就是一个html的内容
# mo.save('text.html')3. North Arrow
The North Arrow function is not necessarily necessary for maps, but adding it It's always good to go up. The use of FloatImage can achieve this function, although the relevant content is not mentioned in the official documentation and source code analysis. There are many plug-ins provided in the official documentation, the most widely used of which is the HeatMap method called heat map.
The FloatImage method implements placing a picture on the screen and specifying the size of the picture and the position on the screen. The parameters are integers (the FloatImage method implements percentage conversion). Based on the second code, we added the image to the lower left corner.
fg.add_child(FloatImage(os.path.join(base, 'map_png', 'image', 'compass.png'), left=5, bottom=10, width=5))
4. Add js and css to folium
folium official does not provide relevant methods for adding js and css. Many methods on the Internet should be extracted based on interpreting the source code. Relatively speaking, It is relatively simple, and there are no relevant instructions on how to add js and css.
It can be known from the source code that the map function in folium is implemented through jinjia2 to load HTML for data and map.
There are three main methods of adding data and maps used in the source code. These methods have flaws (can only be added at the front). These methods can be used in most scenarios. If they do not involve operations on map objects, these three methods can meet the requirements.
1.Header adds js and css
    init_script = """
        var mapsPlaceholder = [];
        L.Map.addInitHook(function () {mapsPlaceholder.push(this);});
    """
    # 加在header最上边
    mo.get_root().header.add_child(folium.Element(init_script))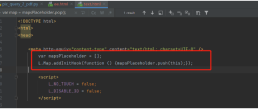
2.body adds js and css
    init_script = """
        var mapsPlaceholder = [];
        L.Map.addInitHook(function () {mapsPlaceholder.push(this);});
    """
    # 加在body中
    mo.get_root().html.add_child(folium.Element(init_script))
3.script to add js and css
    init_script = """
        var mapsPlaceholder = [];
        L.Map.addInitHook(function () {mapsPlaceholder.push(this);});
    """
    # 加在script中
    mo.get_root().script.add_child(folium.Element(init_script))
5. Longitude and latitude grid lines
The previous step implemented adding js and css in different locations of the html file method, if it involves the operation of the map object, there may be situations that are not satisfactory, such as adding longitude and latitude grid lines. It is troublesome to implement the function of latitude and longitude grid lines. The main difficulties are as follows:
1. There are no official relevant methods and plug-ins (currently none);
2.folium relies on leadlet.js for implementation If you want to implement the third-party library of latitude and longitude, you need to be familiar with leaflet (only one related article was found on the Internet);
3. The above article is completed by the front end, and there is no direct back-end implementation method.
4. The front-end implementation method is to directly build the map. Here, the map creation object is not available (the map object is randomly generated).
How to determine the latitude and longitude grid lines?
We need to store the object when creating the map object, then get the map object and implement the grid lines according to the zoom level. An important task is to ensure that the JavaScript code is correctly embedded into the HTML page before and after creating the map object.
It has been implemented to store the object in four when the map object is created. By studying the folium source code, the method of adding js has been rewritten to add js after the map object is created.

1.html page to implement the latitude and longitude grid

<!DOCTYPE html>
<html lang="en">
<head>
<meta charset="UTF-8" />
<meta http-equiv="X-UA-Compatible" content="IE=edge" />
<meta name="viewport" content="width=device-width, initial-scale=1.0" />
<link
rel="stylesheet"
href="https://unpkg.com/leaflet@1.7.1/dist/leaflet.css" rel="external nofollow"
/>
<script src="https://unpkg.com/leaflet@1.7.1/dist/leaflet.js"></script>
<title>leaflet-经纬网格</title>
<style>
html,
body {
width: 100%;
height: 100%;
padding: 0;
margin: 0;
}
.leaflet-div-icon {
background: none;
border: none;
}
</style>
</head>
<body>
<div id="map" ></div>
<script>
let map = L.map("map", { renderer: L.canvas({ padding: 0.5 }) }).setView(
[25.127879288597576, 118.37905883789064],
4
);
// 添加背景图层
L.tileLayer("https://{s}.tile.openstreetmap.org/{z}/{x}/{y}.png", {
attribution:
'© <a href="https://www.openstreetmap.org/copyright" rel="external nofollow" >OpenStreetMap</a> contributors',
}).addTo(map);
// 创建图层
let lonLatGridLineLayer = L.featureGroup().addTo(map);
// 经纬网格生成方法
let addLonLatLine = () => {
let zoom = map.getZoom();
let bounds = map.getBounds();
let north = bounds.getNorth();
let east = bounds.getEast();
// 经纬度间隔
let d = 90 / Math.pow(2, zoom - 1);
// 经线网格
for (let index = -180; index <= 360; index += d) {
// 判断当前视野内
if (bounds.contains([north, index])) {
// 绘制经线
let lonLine = L.polyline(
[
[-90, index],
[90, index],
],
{ weight: 1, color: "blue" }
);
lonLatGridLineLayer.addLayer(lonLine);
// 标注
let text = index.toFixed(1) + "°";
// 动态计算小数位数
if (zoom > 10) {
text = index.toFixed((zoom - 8) / 2) + "°";
}
let divIcon = L.divIcon({
html: `<div >${text}</div>`,
iconAnchor: [0, -5],
});
let textMarker = L.marker([north, index], { icon: divIcon });
lonLatGridLineLayer.addLayer(textMarker);
}
}
if(d>90)d=90;
// 纬线网格
for (let index = -90; index <= 90; index += d) {
if (bounds.contains([index, east])) {
let lonLine = L.polyline(
[
[index, -180],
[index, 360],
],
{ weight: 1, color: "blue" }
);
lonLatGridLineLayer.addLayer(lonLine);
// 标注
let text = index.toFixed(1) + "°";
if (zoom > 10) {
text = index.toFixed((zoom - 8) / 2) + "°";
}
let divIcon = L.divIcon({
html: `<div >${text}</div>`,
iconAnchor: [(text.length + 1) * 6, 0],
});
let textMarker = L.marker([index, east], { icon: divIcon });
lonLatGridLineLayer.addLayer(textMarker);
}
}
};
addLonLatLine();
map.on("zoomend move", () => {
lonLatGridLineLayer.clearLayers();
addLonLatLine();
});
</script>
</body>
</html>2. Customize the grid line class
Through the class inheritance relationship of the source code, I inherit the MacroElement class.
from branca.element import MacroElement,
from jinja2 import Template
from folium.vector_layers import path_options
class Jwwg(MacroElement):
"""自定义经纬线网格"""
_template = Template("""
{% macro script(this, kwargs) %}
var map = mapsPlaceholder.pop();
// 创建图层
let lonLatGridLineLayer = L.featureGroup().addTo(map);
// 经纬网格生成方法
let addLonLatLine = () => {
let zoom = map.getZoom();
let bounds = map.getBounds();
let north = bounds.getNorth();
let east = bounds.getEast();
// 经纬度间隔
let d = 90 / Math.pow(2, zoom - 1);
// 经线网格
for (let index = -180; index <= 360; index += d) {
// 判断当前视野内
if (bounds.contains([north, index])) {
// 绘制经线
let lonLine = L.polyline(
[
[-90, index],
[90, index],
],
{weight: 1, color: "blue"}
);
lonLatGridLineLayer.addLayer(lonLine);
// 标注
let text = index.toFixed(1) + "°";
// 动态计算小数位数
if (zoom > 10) {
text = index.toFixed((zoom - 8) / 2) + "°";
}
let divIcon = L.divIcon({
html: `<div >${text}</div>`,
iconAnchor: [0, -5],
});
let textMarker = L.marker([north, index], {icon: divIcon});
lonLatGridLineLayer.addLayer(textMarker);
}
}
if (d > 90) d = 90;
// 纬线网格
for (let index = -90; index <= 90; index += d) {
if (bounds.contains([index, east])) {
let lonLine = L.polyline(
[
[index, -180],
[index, 360],
],
{weight: 1, color: "blue"}
);
lonLatGridLineLayer.addLayer(lonLine);
// 标注
let text = index.toFixed(1) + "°";
if (zoom > 10) {
text = index.toFixed((zoom - 8) / 2) + "°";
}
let divIcon = L.divIcon({
html: `<div >${text}</div>`,
iconAnchor: [(text.length + 1) * 6, 0],
});
let textMarker = L.marker([index, east], {icon: divIcon});
lonLatGridLineLayer.addLayer(textMarker);
}
}
};
addLonLatLine();
map.on("zoomend move", () => {
lonLatGridLineLayer.clearLayers();
addLonLatLine();
});
{% endmacro %}
""")
def __init__(self, **kwargs):
super(Jwwg, self).__init__()
self._name = 'Jwwg'
self.options = path_options(line=True, **kwargs)3. Implement grid lines
import folium
def map2png(map_data,out_file='pdf.png'):
# 1.直接构造,默认底图
mo = folium.Map(location=[0, 0])
# 2.图层1-高德底图+数据
fg = folium.FeatureGroup()
# 2.1 高德地图
fg.add_child(folium.TileLayer(
tiles='http://webrd02.is.autonavi.com/appmaptile?lang=zh_cn&size=1&scale=1&style=8&x={x}&y={y}&z={z}',
attr="© <a href=http://ditu.amap.com/>高德地图</a>",
min_zoom=0,
max_zoom=19,
control=True,
zoom_control=False,
show=True))
# 2.2添加一个点
fg.add_child(folium.Marker(
location=[45.3311, -121.7113],
popup="Timberline Lodge",
icon=folium.Icon(color="green")))
# 2.3添加一个线形
fg.add_child(folium.PolyLine(
locations=[[38.68,115.67],
[38.85,115.48],
[38.65,115.37],
[38.68,115.67]],
color='green', weight=2, opacity=1))
# 2.4添加一个面
fg.add_child(folium.Polygon(
locations=[[38.68,115.67],
[38.85,115.48],
[38.65,115.37],
[38.68,115.67]],
color='green', weight=2,
fill=True,fill_color = 'red'))
# 2.5将我们的图层加入map
mo.add_child(fg)
# 5.根据范围缩放地图
mo.fit_bounds([[38.68,115.67],
[38.85,115.48],
[38.65,115.37],
[38.68,115.67]])
# 网格线
init_script = """
var mapsPlaceholder = [];
L.Map.addInitHook(function () {mapsPlaceholder.push(this);});
"""
mo.get_root().script.add_child(folium.Element(init_script))
Jwwg().add_to(mo)
root = mo.get_root()
html = root.render() # 这个拿到的就是一个html的内容
# mo.save('text.html')The above is the detailed content of How to use the functions of Python folium. For more information, please follow other related articles on the PHP Chinese website!

 How do you slice a Python array?May 01, 2025 am 12:18 AM
The basic syntax for Python list slicing is list[start:stop:step]. 1.start is the first element index included, 2.stop is the first element index excluded, and 3.step determines the step size between elements. Slices are not only used to extract data, but also to modify and invert lists.
 Under what circumstances might lists perform better than arrays?May 01, 2025 am 12:06 AM
Listsoutperformarraysin:1)dynamicsizingandfrequentinsertions/deletions,2)storingheterogeneousdata,and3)memoryefficiencyforsparsedata,butmayhaveslightperformancecostsincertainoperations.
 How can you convert a Python array to a Python list?May 01, 2025 am 12:05 AM
ToconvertaPythonarraytoalist,usethelist()constructororageneratorexpression.1)Importthearraymoduleandcreateanarray.2)Uselist(arr)or[xforxinarr]toconvertittoalist,consideringperformanceandmemoryefficiencyforlargedatasets.
 What is the purpose of using arrays when lists exist in Python?May 01, 2025 am 12:04 AM
ChoosearraysoverlistsinPythonforbetterperformanceandmemoryefficiencyinspecificscenarios.1)Largenumericaldatasets:Arraysreducememoryusage.2)Performance-criticaloperations:Arraysofferspeedboostsfortaskslikeappendingorsearching.3)Typesafety:Arraysenforc
 Explain how to iterate through the elements of a list and an array.May 01, 2025 am 12:01 AM
In Python, you can use for loops, enumerate and list comprehensions to traverse lists; in Java, you can use traditional for loops and enhanced for loops to traverse arrays. 1. Python list traversal methods include: for loop, enumerate and list comprehension. 2. Java array traversal methods include: traditional for loop and enhanced for loop.
 What is Python Switch Statement?Apr 30, 2025 pm 02:08 PM
The article discusses Python's new "match" statement introduced in version 3.10, which serves as an equivalent to switch statements in other languages. It enhances code readability and offers performance benefits over traditional if-elif-el
 What are Exception Groups in Python?Apr 30, 2025 pm 02:07 PM
Exception Groups in Python 3.11 allow handling multiple exceptions simultaneously, improving error management in concurrent scenarios and complex operations.
 What are Function Annotations in Python?Apr 30, 2025 pm 02:06 PM
Function annotations in Python add metadata to functions for type checking, documentation, and IDE support. They enhance code readability, maintenance, and are crucial in API development, data science, and library creation.


Hot AI Tools

Undresser.AI Undress
AI-powered app for creating realistic nude photos

AI Clothes Remover
Online AI tool for removing clothes from photos.

Undress AI Tool
Undress images for free

Clothoff.io
AI clothes remover

Video Face Swap
Swap faces in any video effortlessly with our completely free AI face swap tool!

Hot Article
Hot Tools

WebStorm Mac version
Useful JavaScript development tools

Dreamweaver Mac version
Visual web development tools

ZendStudio 13.5.1 Mac
Powerful PHP integrated development environment

PhpStorm Mac version
The latest (2018.2.1) professional PHP integrated development tool

EditPlus Chinese cracked version
Small size, syntax highlighting, does not support code prompt function

