Home >Backend Development >Python Tutorial >How to use Pyecharts for Python data visualization
How to use Pyecharts for Python data visualization
- WBOYWBOYWBOYWBOYWBOYWBOYWBOYWBOYWBOYWBOYWBOYWBOYWBforward
- 2023-05-12 09:55:052819browse
1. Install Pyecharts
pip install pyecharts
2. Chart basics
2.1 Theme style
Add theme style to use It is the InitOpts() method.
The main parameters of this method are:
| Parameters | Description |
|---|---|
| width | Canvas width, requires string format, such as width="500px" |
| height | Canvas height, requires string Format, such as width="500px" |
| chart_id | Chart ID, as the unique identifier of the chart. Used to distinguish different charts when there are multiple charts |
| page_title | Web page title, string format |
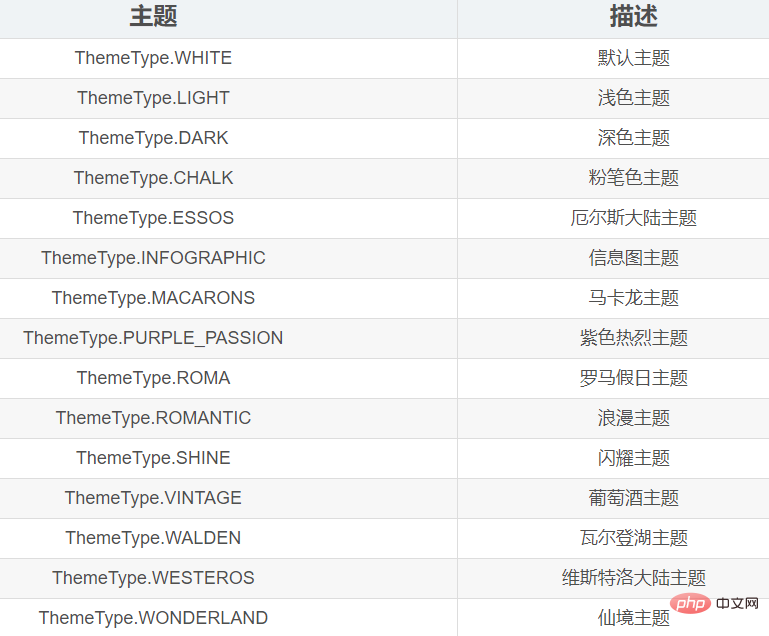
| theme | Chart theme. Provided by ThemeType module |
| bg_color | Chart background color, string format |
The styles that can be selected are :
2.2 Chart title
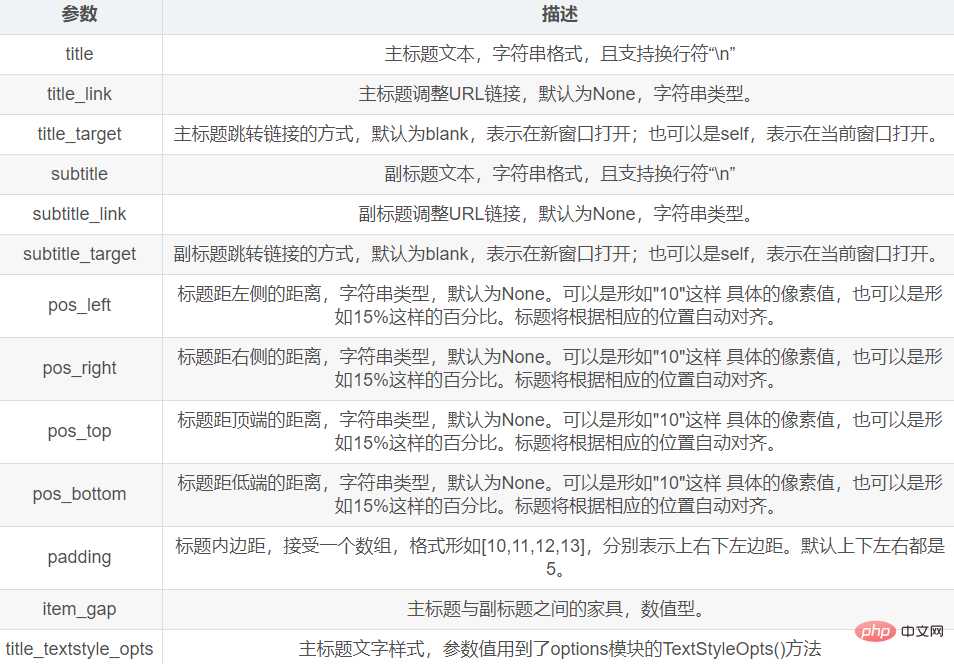
To add a title to the chart, you need to pass the title_opts parameter of the set_global_options() method.
The value of this parameter is passed The TitleOpts() method of the opts module is generated,
and the main parameter syntax of the TitleOpts() method is as follows:
2.3 Legend
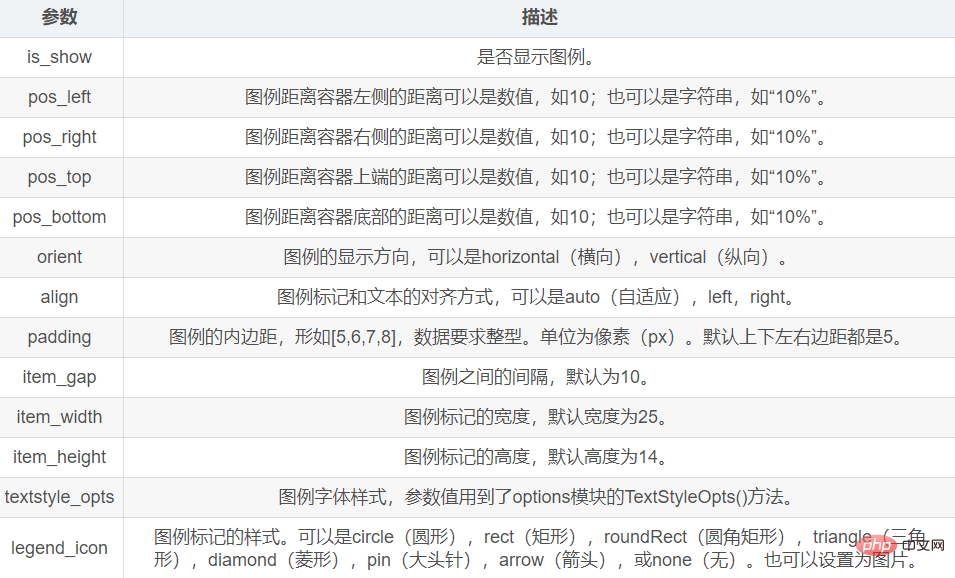
Set the legend You need to pass the legend_opts parameter of the set_global_opts() method.
The parameter value of this parameter refers to the LegendOpts() method of the options module.
The main parameters of the LegendOpts() method are as follows:
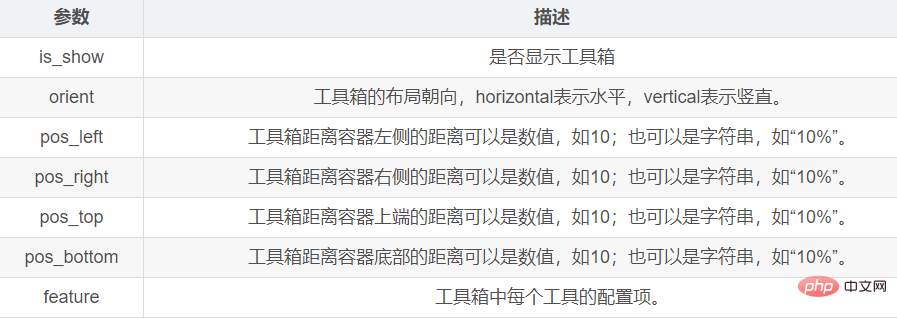
2.4 Prompt box
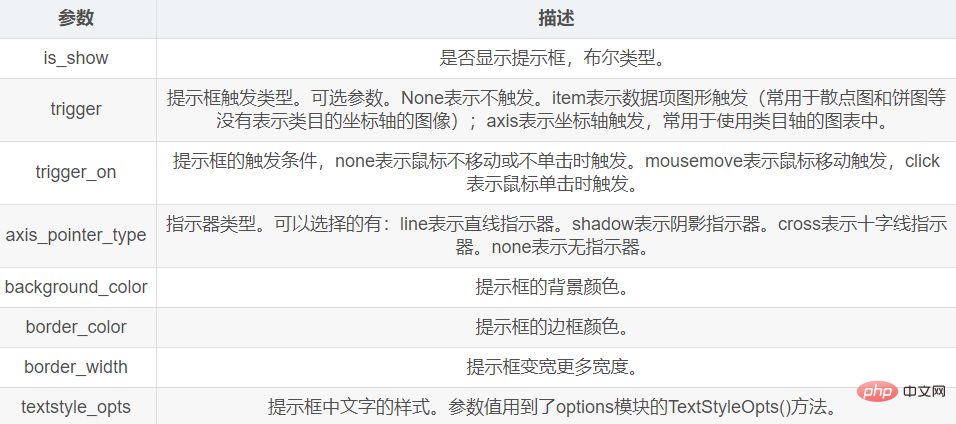
Setting the prompt box is mainly through the set_global_opts() method The tooltip_opts parameter is set.
The parameter value of this parameter refers to the TooltipOpts() method of the options module.
The main parameters of the TooltipOpts() method are as follows:
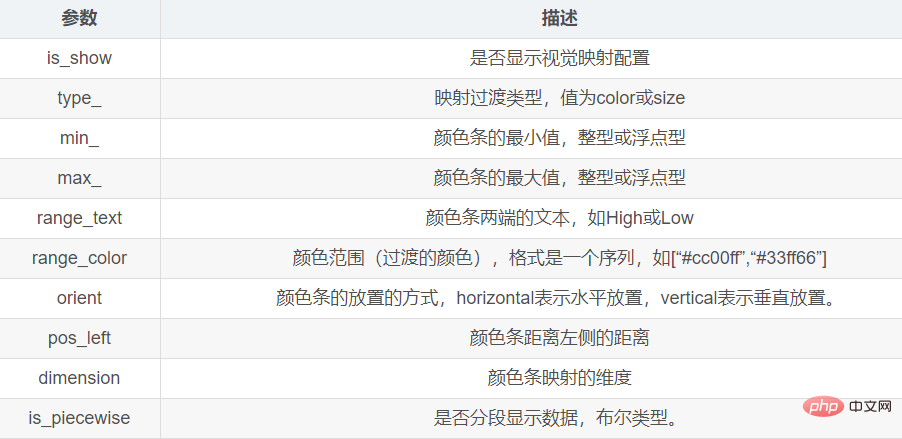
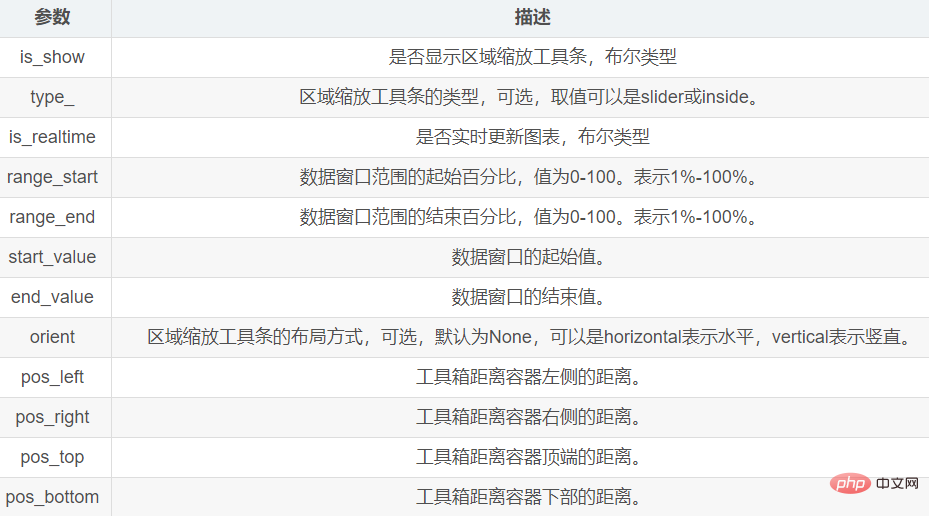
2.5 Visual mapping
Visual mapping passes the visualmap_opts parameter in the set_global_opts() method Make settings.
For the value of this parameter, refer to the VisualMapOpts() method of the options module.
The main parameters are as follows:
 ##3. Histogram Bar module
The histogram is drawn through the Bar module,
The main methods of this module are:
| ##add_xaxis() | |||||||||||||
|---|---|---|---|---|---|---|---|---|---|---|---|---|---|
| add_yaxis() | |||||||||||||
| reversal_axis() | |||||||||||||
| add_dataset() | |||||||||||||
|
下边展示一个简单的示例,先不使用过多复杂的样式: import numpy as np
from pyecharts.charts import Bar
from pyecharts import options as opts
from pyecharts.globals import ThemeType
# 生成数据
years = [2011, 2012, 2013, 2014, 2015]
y1 = [1, 3, 5, 7, 9]
y2 = [2, 4, 6, 4, 2]
y3 = [9, 7, 5, 3, 1]
y4 = list(np.random.randint(1, 10, 10))
bar = Bar(init_opts=opts.InitOpts(theme=ThemeType.LIGHT))
# 为柱状图添加x轴和y轴数据
bar.add_xaxis(years)
bar.add_yaxis('A型', y1)
bar.add_yaxis('B型', y2)
bar.add_yaxis('C型', y3)
bar.add_yaxis('D型', y4)
# 渲染图表到HTML文件,并保存在当前目录下
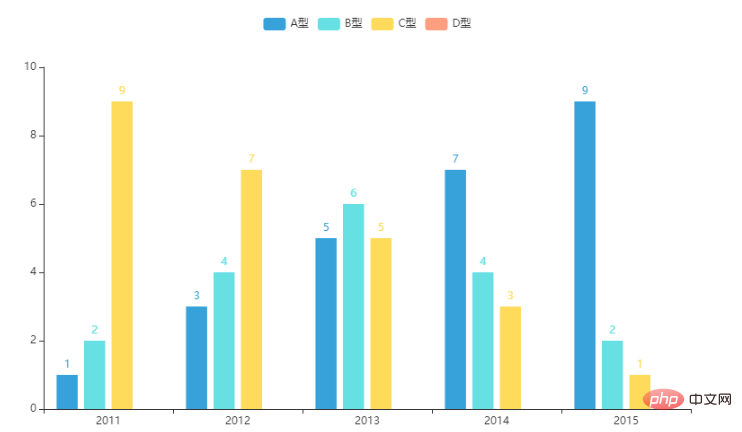
bar.render("bar.html")生成图像效果如下:
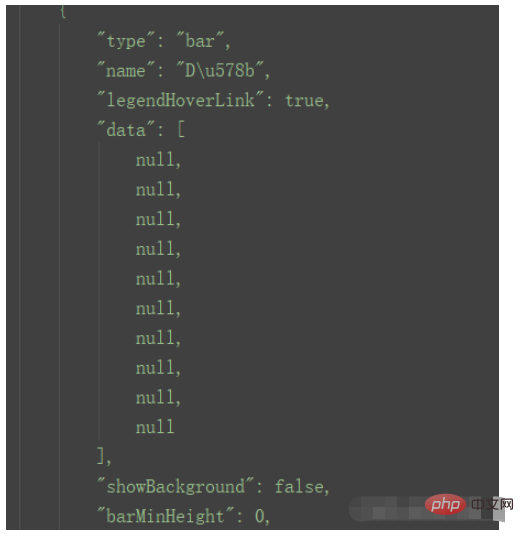
这里有一个无法解释的细节,就是可以看到y4数据,即D型,在图像中没有显示出来。经过小啾的反复尝试,发现凡是使用随机数产生的数据再转化成列表,这部分随机数不会被写入到html文件中:
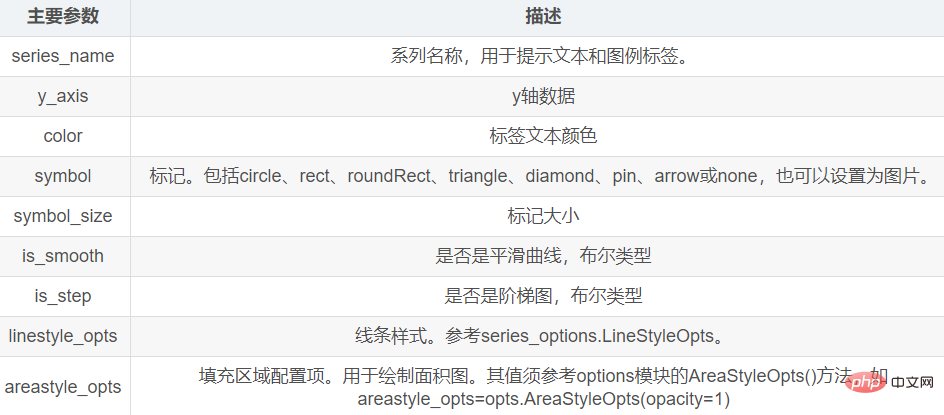
既然不会解释,那就避免。 4. 折线图/面积图 Line模块Line模块的主要方法有add_xaxis() 和 add_yaxis(),分别用来添加x轴数据和y轴数据。 add_yaxis()的主要参数如下:
4.1 折线图绘制折线图时,x轴的数据必须是字符串,图线方可正常显示。 from pyecharts.charts import Line
from pyecharts import options as opts
from pyecharts.globals import ThemeType
# 准备数据
x = [2011, 2012, 2013, 2014, 2015]
x_data = [str(i) for i in x]
y1 = [1, 3, 2, 5, 8]
y2 = [2, 6, 5, 6, 7]
y3 = [5, 7, 4, 3, 1]
line = Line(init_opts=opts.InitOpts(theme=ThemeType.ESSOS))
line.add_xaxis(xaxis_data=x_data)
line.add_yaxis(series_name="A类", y_axis=y1)
line.add_yaxis(series_name="B类", y_axis=y2)
line.add_yaxis(series_name="C类", y_axis=y3)
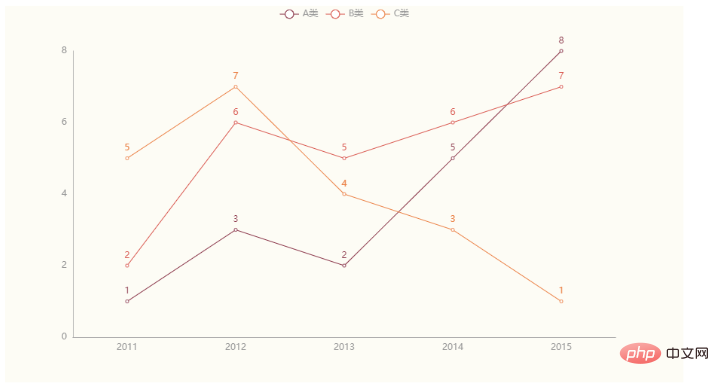
line.render("line.html")生成图像效果如下:
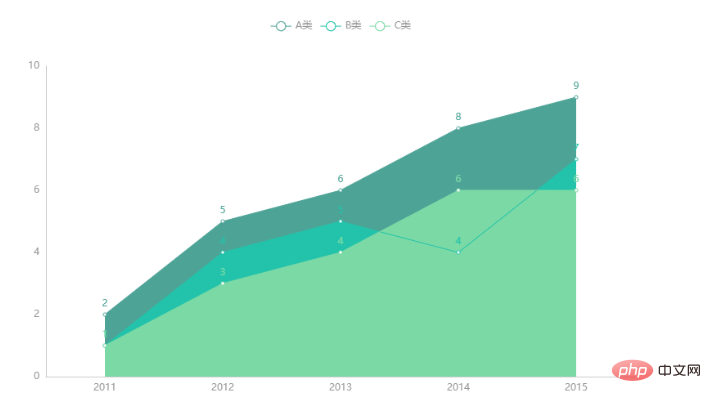
4.2 面积图绘制面积图时需要在add_yaxis()方法中指定areastyle_opts参数。其值由options模块的AreaStyleOpts()方法提供。 from pyecharts.charts import Line
from pyecharts import options as opts
from pyecharts.globals import ThemeType
x = [2011, 2012, 2013, 2014, 2015]
x_data = [str(i) for i in x]
y1 = [2, 5, 6, 8, 9]
y2 = [1, 4, 5, 4, 7]
y3 = [1, 3, 4, 6, 6]
line = Line(init_opts=opts.InitOpts(theme=ThemeType.WONDERLAND))
line.add_xaxis(xaxis_data=x_data)
line.add_yaxis(series_name="A类", y_axis=y1, areastyle_opts=opts.AreaStyleOpts(opacity=1))
line.add_yaxis(series_name="B类", y_axis=y2, areastyle_opts=opts.AreaStyleOpts(opacity=1))
line.add_yaxis(series_name="C类", y_axis=y3, areastyle_opts=opts.AreaStyleOpts(opacity=1))
line.render("line2.html")图像效果如下:
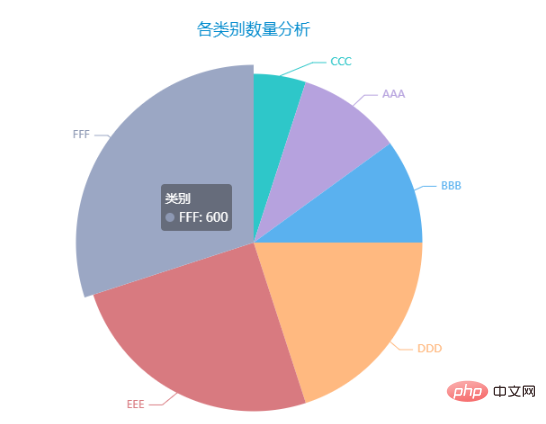
5.饼形图5.1 饼形图绘制饼形图使用的是Pie模块,该模块中需要使用的主要方法是add()方法 该方法主要参数如下:
from pyecharts.charts import Pie
from pyecharts import options as opts
from pyecharts.globals import ThemeType

x_data = ['AAA', 'BBB', 'CCC', 'DDD', 'EEE', 'FFF']
y_data = [200, 200, 100, 400, 500, 600]
# 将数据转换为目标格式
data = [list(z) for z in zip(x_data, y_data)]
# 数据排序
data.sort(key=lambda x: x[1])

pie = Pie(init_opts=opts.InitOpts(theme=ThemeType.MACARONS))

pie.add(
        series_name="类别",    # 序列名称
        data_pair=data,     # 数据
    )
pie.set_global_opts(
        # 饼形图标题
        title_opts=opts.TitleOpts(
            title="各类别数量分析",
            pos_left="center"),
        # 不显示图例
        legend_opts=opts.LegendOpts(is_show=False),
    )
pie.set_series_opts(
        # 序列标签
        label_opts=opts.LabelOpts(),
    )

pie.render("pie.html")
图像效果如下:
5.2 南丁格尔玫瑰图from pyecharts.charts import Pie
from pyecharts import options as opts
from pyecharts.globals import ThemeType
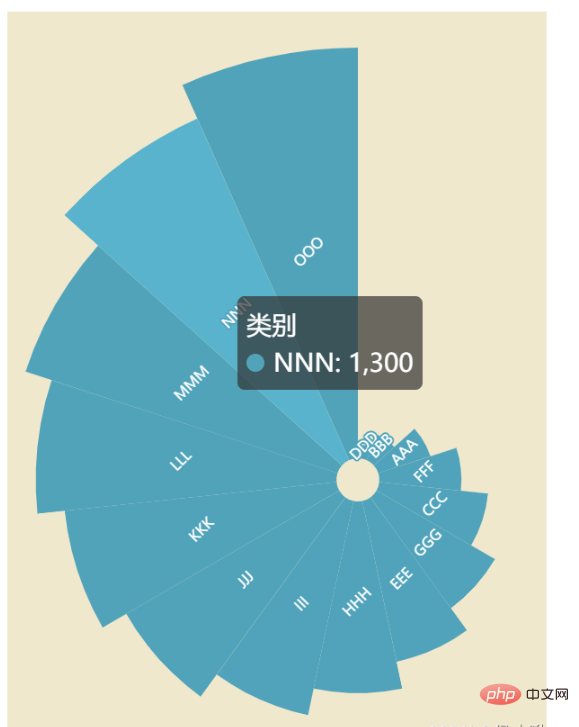
x_data = ['AAA', 'BBB', 'CCC', 'DDD', 'EEE', 'FFF', 'GGG', 'HHH', 'III', 'JJJ', 'KKK', 'LLL', 'MMM', 'NNN', 'OOO']
y_data = [200, 100, 400, 50, 600, 300, 500, 700, 800, 900, 1000, 1100, 1200, 1300, 1500]
# 将数据转换为目标格式
data = [list(z) for z in zip(x_data, y_data)]
# 数据排序
data.sort(key=lambda x: x[1])
# 创建饼形图并设置画布大小
pie = Pie(init_opts=opts.InitOpts(theme=ThemeType.ROMANTIC, width='300px', height='400px'))
# 为饼形图添加数据
pie.add(
series_name="类别",
data_pair=data,
radius=["8%", "160%"], # 内外半径
center=["65%", "65%"], # 位置
rosetype='area', # 玫瑰图,圆心角相同,按半径大小绘制
color='auto' # 颜色自动渐变
)
pie.set_global_opts(
# 不显示图例
legend_opts=opts.LegendOpts(is_show=False),
# 视觉映射
visualmap_opts=opts.VisualMapOpts(is_show=False,
min_=100, # 颜色条最小值
max_=450000, # 颜色条最大值
)
)
pie.set_series_opts(
# 序列标签
label_opts=opts.LabelOpts(position='inside', # 标签位置
rotate=45,
font_size=8) # 字体大小
)
pie.render("pie2.html")图像效果如下:
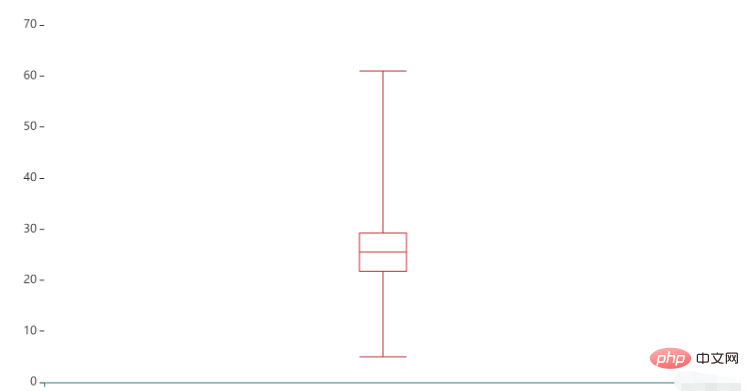
6. 箱线图 Boxplot模块绘制箱线图使用的是Boxplot类。 这里有一个细节,准备y轴数据y_data时需要在列表外再套一层列表,否则图线不会被显示。 绘制箱线图使用的是Boxplot模块, 主要的方法有 add_xaxis()和add_yaxis() from pyecharts.charts import Boxplot
from pyecharts.globals import ThemeType
from pyecharts import options as opts
y_data = [[5, 20, 22, 21, 23, 26, 25, 24, 28, 26, 29, 30, 50, 61]]
boxplot = Boxplot(init_opts=opts.InitOpts(theme=ThemeType.INFOGRAPHIC))
boxplot.add_xaxis([""])
boxplot.add_yaxis('', y_axis=boxplot.prepare_data(y_data))
boxplot.render("boxplot.html")图像效果如下:
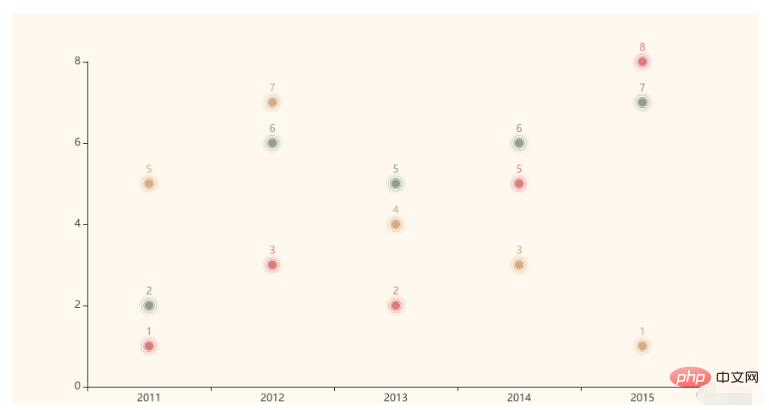
7. 涟漪特效散点图 EffectScatter模块绘制涟漪图使用的是EffectScatter模块,代码示例如下: from pyecharts.charts import EffectScatter
from pyecharts import options as opts
from pyecharts.globals import ThemeType
x = [2011, 2012, 2013, 2014, 2015]
x_data = [str(i) for i in x]
y1 = [1, 3, 2, 5, 8]
y2 = [2, 6, 5, 6, 7]
y3 = [5, 7, 4, 3, 1]
scatter = EffectScatter(init_opts=opts.InitOpts(theme=ThemeType.VINTAGE))
scatter.add_xaxis(x_data)
scatter.add_yaxis("", y1)
scatter.add_yaxis("", y2)
scatter.add_yaxis("", y3)
# 渲染图表到HTML文件,存放在程序所在目录下
scatter.render("EffectScatter.html")图像效果如下:
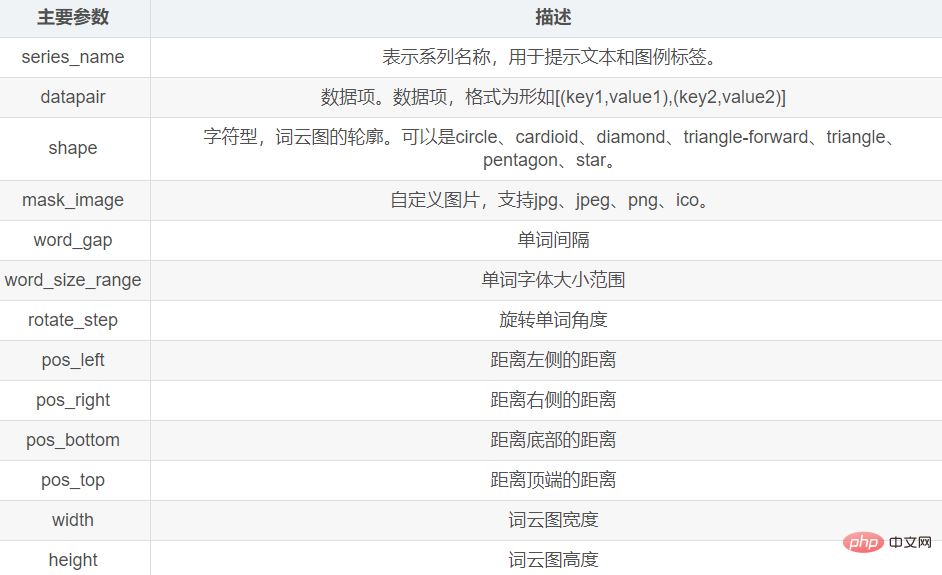
8. 词云图 WordCloud模块绘制词云图使用的是WordCloud模块, 主要的方法有add()方法。 add()方法的主要参数如下: add()方法主要的参数有
准备一个txt文件(001.txt),文本内容以《兰亭集序》为例:
代码示例如下: from pyecharts.charts import WordCloud
from jieba import analyse
# 基于TextRank算法从文本中提取关键词
textrank = analyse.textrank
text = open('001.txt', 'r', encoding='UTF-8').read()
keywords = textrank(text, topK=30)
list1 = []
tup1 = ()
# 关键词列表
for keyword, weight in textrank(text, topK=30, withWeight=True):
# print('%s %s' % (keyword, weight))
tup1 = (keyword, weight) # 关键词权重
list1.append(tup1) # 添加到列表中
# 绘制词云图
mywordcloud = WordCloud()
mywordcloud.add('', list1, word_size_range=[20, 100])
mywordcloud.render('wordclound.html')词云图效果如下:
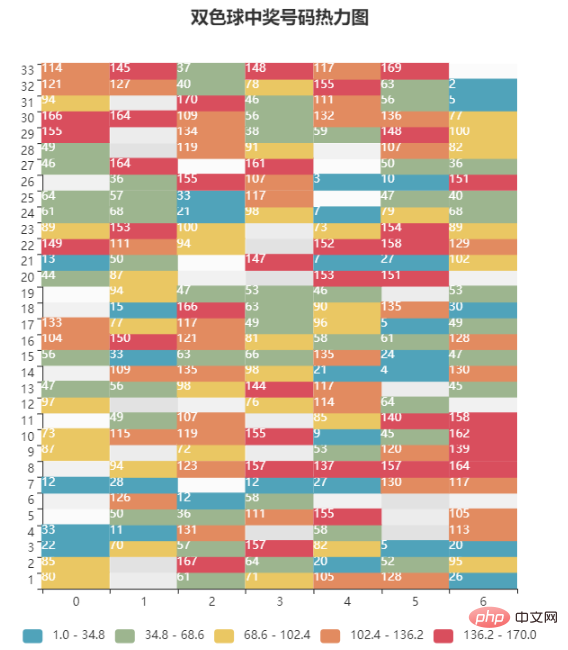
9. 热力图 HeatMap模块绘制热力图使用的是HeatMap模块。 下边以双色球案例为例,数据使用生成的随机数,绘制出热力图: import pyecharts.options as opts
from pyecharts.charts import HeatMap
import pandas as pd
import numpy as np
# 创建一个33行7列的DataFrame,数据使用随机数生成。每个数据表示该位置上该数字出现的次数
s1 = np.random.randint(0, 200, 33)
s2 = np.random.randint(0, 200, 33)
s3 = np.random.randint(0, 200, 33)
s4 = np.random.randint(0, 200, 33)
s5 = np.random.randint(0, 200, 33)
s6 = np.random.randint(0, 200, 33)
s7 = np.random.randint(0, 200, 33)
data = pd.DataFrame(
{'位置一': s1,
'位置二': s2,
'位置三': s3,
'位置四': s4,
'位置五': s5,
'位置六': s6,
'位置七': s7
},
index=range(1, 34)
)
# 数据转换为HeatMap支持的列表格式
value1 = []
for i in range(7):
for j in range(33):
value1.append([i, j, int(data.iloc[j, i])])
# 绘制热力图
x = data.columns
heatmap=HeatMap(init_opts=opts.InitOpts(width='600px' ,height='650px'))
heatmap.add_xaxis(x)
heatmap.add_yaxis("aa", list(data.index), value=value1, # y轴数据
# y轴标签
label_opts=opts.LabelOpts(is_show=True, color='white', position="center"))
heatmap.set_global_opts(title_opts=opts.TitleOpts(title="双色球中奖号码热力图", pos_left="center"),
legend_opts=opts.LegendOpts(is_show=False), # 不显示图例
# 坐标轴配置项
xaxis_opts=opts.AxisOpts(
type_="category", # 类目轴
# 分隔区域配置项
splitarea_opts=opts.SplitAreaOpts(
is_show=True, # 区域填充样式
areastyle_opts=opts.AreaStyleOpts(opacity=1)
),
),
# 坐标轴配置项
yaxis_opts=opts.AxisOpts(
type_="category", # 类目轴
# 分隔区域配置项
splitarea_opts=opts.SplitAreaOpts(
is_show=True,
# 区域填充样式
areastyle_opts=opts.AreaStyleOpts(opacity=1)
),
),
# 视觉映射配置项
visualmap_opts=opts.VisualMapOpts(is_piecewise=True, # 分段显示
min_=1, max_=170, # 最小值、最大值
orient='horizontal', # 水平方向
pos_left="center") # 居中
)
heatmap.render("heatmap.html")热力图效果如下:
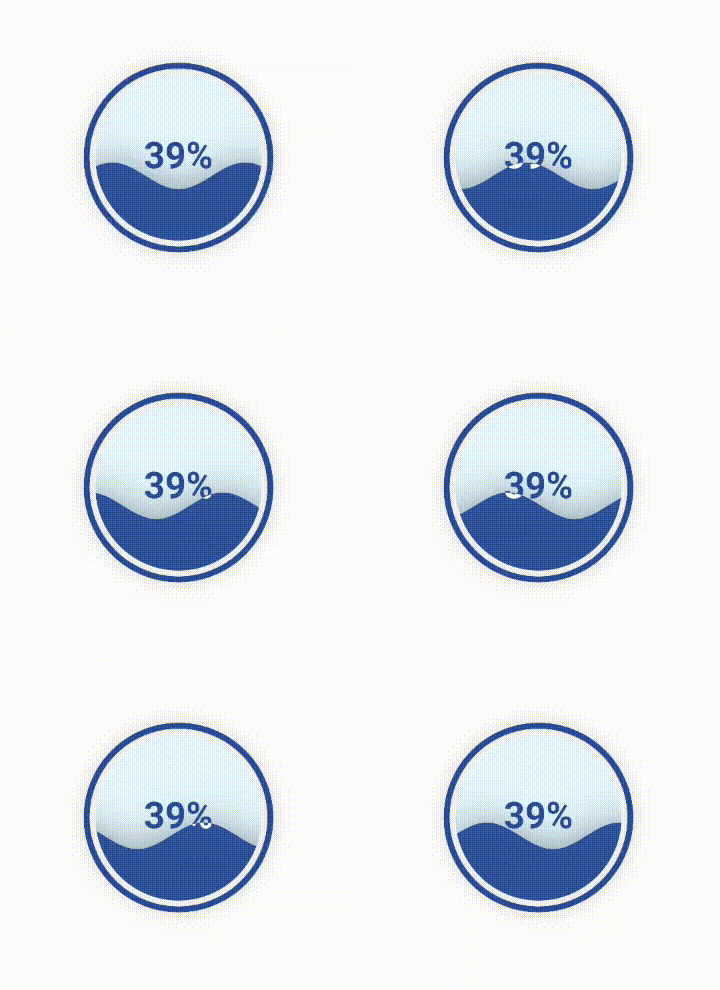
10. 水球图 Liquid模块绘制水球图使用的是Liquid模块。 from pyecharts.charts import Liquid
liquid = Liquid()
liquid.add('', [0.39])
liquid.render("liquid.html")水球图效果如下:
11. 日历图 Calendar模块绘制日历图使用的是Calendar模块 主要使用的方法是add()方法 import pandas as pd
import numpy as np
from pyecharts import options as opts
from pyecharts.charts import Calendar
data = list(np.random.random(30))
# 求最大值和最小值
mymax = round(max(data), 2)
mymin = round(min(data), 2)
# 生成日期
index = pd.date_range('20220401', '20220430')
# 合并列表
data_list = list(zip(index, data))
# 生成日历图
calendar = Calendar()
calendar.add("",
data_list,
calendar_opts=opts.CalendarOpts(range_=['2022-04-01', '2022-04-30']))
calendar.set_global_opts(
title_opts=opts.TitleOpts(title="2022年4月某指标情况", pos_left='center'),
visualmap_opts=opts.VisualMapOpts(
max_=mymax,
min_=mymin+0.1,
orient="horizontal",
is_piecewise=True,
pos_top="230px",
pos_left="70px",
),
)
calendar.render("calendar.html")日历图效果如下:
|
The above is the detailed content of How to use Pyecharts for Python data visualization. For more information, please follow other related articles on the PHP Chinese website!


