
Home >Technology peripherals >AI >Graph machine learning is everywhere, using Transformer to alleviate GNN limitations
Graph machine learning is everywhere, using Transformer to alleviate GNN limitations

- WBOYWBOYWBOYWBOYWBOYWBOYWBOYWBOYWBOYWBOYWBOYWBOYWBforward
- 2023-05-02 10:07:061392browse
In our life today, examples of graphs include social networks, such as Twitter, Mastodon, and any citation network linking papers and authors, molecules, knowledge graphs, such as UML diagrams, encyclopedias, and anything with hyperlinks Websites, sentences represented as syntactic trees, and any 3D grid, etc., it can be said that graphs are everywhere.
Recently, Hugging Face research scientist Clémentine Fourrier introduced today's ubiquitous graph machine learning in the article "Introduction to Graph Machine Learning". What are graphics? Why use graphs? How best to represent a graph? How do people learn from graphs? Clémentine Fourrier pointed out that a graph is a description of items linked by relationships. Among them, from pre-neural methods to graph neural networks are still commonly used graph learning methods.
In addition, some researchers have recently begun to consider applying Transformers to graphs. Transformers have good scalability and can alleviate some of the limitations of GNN, and the prospects are very promising.
1 The graph is a description of the relationship-linked items
Essentially, the graph is a description of the relationship-linked items. Items of a graph (or network) are called nodes (or vertices) and are connected by edges (or links). For example, in a social network, nodes are users and edges are connections between users; in molecules, nodes are atoms and edges are their molecular bonds.
- A graph with typed nodes or typed edges is called a heterogeneous graph. For example, items in a citation network can be papers or authors, with typed nodes, And relationships in XML graphs have typed edges; it cannot be represented simply by its topology, but additional information is required
- Graphs can also be directed (e.g. follower networks, A follows B does not mean that B follows A) or undirected (for example, the relationship between molecules and atoms is bidirectional). Edges can connect different nodes or a node with itself (self-edge), but not all nodes need to be connected
As you can see, when using data, you must first consider its optimal Representation, including homogeneous/heterogeneous, directed/undirected, etc.
At the graph level, the main tasks include the following:
- Graph generation for drug discovery to generate new rational molecules
- Graph evolution, that is, given a graph to predict how it will evolve over time, can be used in physics to predict the evolution of a system
- Graph-level prediction, classification or regression tasks from graphs, such as predicting the toxicity of molecules
Node layer is usually prediction of node attributes, for example Alphafold uses node attribute prediction to predict It is a difficult biochemical problem to predict how a molecule will fold in 3D space given the 3D coordinates of the atoms in the overall diagram of the molecule.
Edge prediction includes edge attribute prediction and missing edge prediction. Edge attribute prediction helps predict drug side effects, given the adverse side effects of a pair of drugs; missing edge prediction is used in recommendation systems to predict whether two nodes in the graph are related.
At the subgraph level, community detection or subgraph attribute prediction can be performed. Social networks can use community detection to determine how people are connected. Subgraph attribute prediction is often used in itinerary systems, such as Google Maps, which can be used to predict estimated arrival times.
When it comes to predicting the evolution of a specific graph, everything in the transformation setup, including training, validation, and testing, can be done on the same graph. But creating training, evaluation, or test datasets from a single graph is not easy, and a lot of work is done using different graphs (separate training/evaluation/test splits), which is called an induction setting.
There are two common ways to represent graph processing and operations, either as a set of all its edges (possibly supplemented by a set of all its nodes), or as a set of all its nodes adjacency matrix between. Among them, the adjacency matrix is a square matrix (node size × node size) indicating which nodes are directly connected to other nodes. Note that having a sparse adjacency matrix makes the computation more difficult since most graphs are not densely connected.
Graphs are very different from typical objects used in ML, since their topology is more complex than "sequences" (like text and audio) or "ordered grids" (like images and videos): even though one can It is represented as a list or matrix, but this representation cannot be considered an ordered object. That is, if you scramble the words in a sentence, you create a new sentence, and if you scramble an image and rearrange its columns, you create a new image.
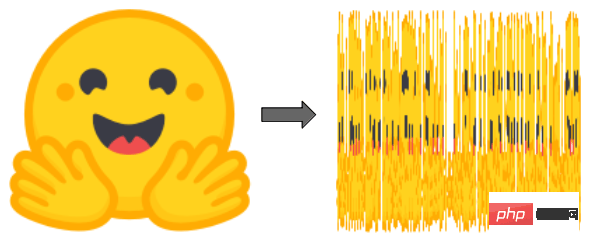
Note: The Hugging Face logo and the disrupted Hugging Face logo are completely different new images
But this is not the case with graphs: if we shuffle the edge lists or columns of the adjacency matrix of the graph, it is still the same graph.
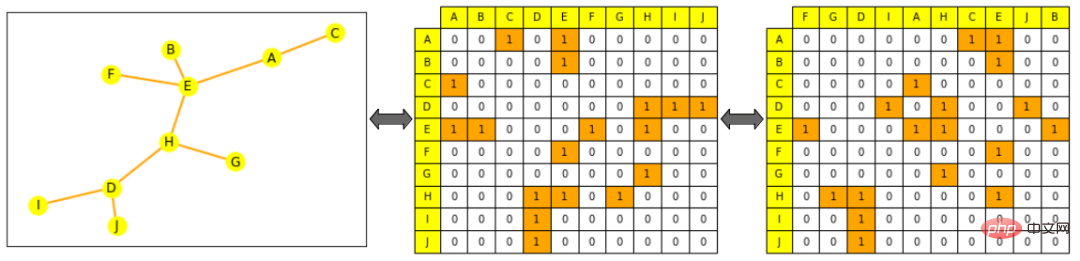
Note: On the left is a small picture, yellow represents nodes, orange represents edges; the adjacency matrix on the center picture, columns and The rows are arranged in node alphabetical order: the row for node A (the first row) can be seen to be connected to E and C; the picture on the right has the adjacency matrix scrambled (the columns are no longer alphabetically ordered), which is still a valid representation of the graph, That is, A is still connected to E and C Predictors are trained for the target task by first generating a meaningful representation for the project, where nodes, edges, or complete graphs depend on specific task requirements. As with other patterns, you can constrain the mathematical representation of an object so that it is mathematically close to a similar object. But within this, similarity is difficult to strictly define in graph ML: for example, are two nodes more similar when they have the same label or the same neighbors?
As shown below, this article focuses on generating node representations. Once there is a node-level representation, it is possible to obtain edge or graph-level information. For edge-level information, you can connect pairs of nodes or do point multiplication; for graph-level information, you can perform global pooling on the concatenated tensors represented by all node levels, including averaging, summation, etc. However, it would still smooth out and lose information about the entire graph - a recursive hierarchical collection might make more sense, or add a dummy node that is connected to all other nodes in the graph and represent it as the entire graph. express.
Pre-neural approach
Simple use of engineering features
Before neural networks, graphs and their items of interest could be represented as combinations of features in a task-specific way. Today, these features are still used in data augmentation and semi-supervised learning, and although more sophisticated methods of feature generation exist, it is crucial to find how best to feed these features to the network depending on the task.
Node-level features can provide information about importance as well as structure-based information and combine them.
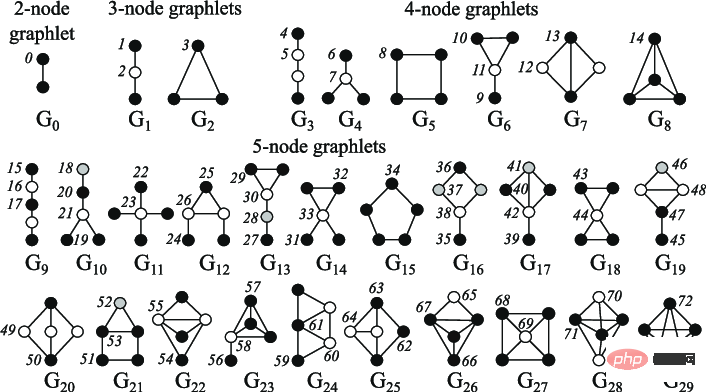
Node centrality can be used to measure the importance of nodes in the graph, calculated recursively by summing the neighbor centralities of each node until convergence, or by the shortest distance measure between nodes To calculate recursively, the node degree is the number of direct neighbors it has; the clustering coefficient measures the degree of connection of the node neighbors; the Graphlets degree vector calculation can calculate how many different graphlets are rooted at a given node, where graphlets can be used to give Create all sparklines with a certain number of connected nodes.
Note: 2 to 5 node diagram
 Edge level Features are supplemented by more detailed information about node connectivity, including the shortest distance between two nodes, their common neighbors, and the Katz index, which refers to the path of a certain length that may be traveled between two nodes. - which can be calculated directly from the adjacency matrix).
Graph-level features contain high-level information about graph similarities and distinctiveness, where subgraph counts, although computationally expensive, provide information about subgraph shapes. The core method measures the similarity between graphs through different "bag-of-nodes" methods (similar to bag-of-words).
Walking-based method
The walking-based method uses the probability of visiting node j from node i in a random walk to define the similarity measure, These methods combine local and global information. For example, previously Node2Vec simulated random walks between graph nodes, using skip-grams to process these walks just like we do words in sentences to compute embeddings.
These methods can also be used to speed up the calculation of the PageRank method, which assigns each node an importance score based on its connections to other nodes, such as by random walking to evaluate its Access frequency. However, the above methods also have certain limitations. They cannot obtain the embedding of new nodes, cannot capture the structural similarity between nodes well, and cannot use added features.
3 How does graph neural network process graphs?
Neural networks can generalize to unseen data. Given the representation constraints mentioned earlier, how should a good neural network handle graphs?
Two methods are shown below:
- is invariant to substitution:
- Equation: f(P(G))=f(G)f(P(G))=f(G), where f is the network, P is the permutation function, and G is the graph
- Explanation: After passing through the network, the representation and arrangement of the graph should be the same
- is a permutation equivariant
Equation: P(f(G))=f(P(G))P(f(G))=f(P(G)), where f is the network, P is the permutation function and G is the graph
-
#Explanation: Permuting nodes before passing them to the network should be equivalent to permuting their representation
Typical neural networks are not permutation invariant, such as RNN or CNN, so a new architecture - graph neural network - was introduced (originally as a state-based machine ).
A GNN is composed of consecutive layers. A GNN layer represents a node as a combination of the representation of its neighbors and itself from the previous layer (message passing), often with activations added to add some non-linearity. Compared with other models, CNN can be regarded as a GNN with fixed neighbor size (through sliding window) and ordering (non-permutation equivariance); while Transformer without position embedding can be regarded as a GNN on a fully connected input graph.
Aggregation and message passing
There are many ways to aggregate information from node neighbors, such as summation, averaging, and similar aggregation methods that have been used before. Class methods include:
- Graph Convolutional Networks, which averages the normalized representation of node neighbors;
- Graph Attention Networks, Learn to weigh different neighbors according to their importance (like Transformer);
- GraphSAGE, which weights neighbors at different hops before aggregating information in several steps using a maximal set Sampling;
- Graph Isomorphism Networks, aggregate representations by applying MLP to the sum of node neighbor representations.
Choose an aggregation: Some aggregation techniques (particularly average/maximum sets) suffer from failures in creating fine-grained representations that distinguish different node neighbor representations of similar nodes. Situation; for example, through the mean set, a neighbor with 4 nodes represented as 1, 1, -1, -1, with an average of 0, is no different from a neighbor with only 3 nodes represented as -1, 0, 1 .
GNN shape and over-smoothing issues
At each new layer, the node representation includes more and more nodes. A node passes through the first layer, an aggregation of its direct neighbors. Through the second layer, it is still an aggregation of its immediate neighbors, but now its representation also includes their own neighbors (from the first layer). After n levels, the representation of all nodes becomes the set of all its neighbors with distance n, and therefore an aggregation of the full graph if its diameter is less than n.
If there are too many network layers, there is a risk that each node becomes an aggregation of the complete graph (and the node representation converges to the same representation for all nodes), which is called overshooting The smoothing problem can be solved by:
- Scaling the GNN to a small enough number of layers that each node is not approximated as the entire network (by first analyzing Diameter and shape of graph)
- Increase layer complexity
- Add non-message passing layer to handle messages (e.g. simple MLP)
- Add skip connections
The over-smoothing problem is an important research area in graph ML because it prevents GNNs from scaling , as Transformers have been demonstrated in other models.
Graph Transformers
Transformer without position coding layer is permutation invariant, and Transformer also has good scalability, so research People have recently begun to consider applying Transformers to graphs. Most methods focus on finding the best features and the best way to represent the graph, and changing the attention to adapt to this new data.
Shown below are some methods that achieve state-of-the-art or close results on Stanford’s Open Graph Benchmark:
- Graph Transformer for Graph-to-Sequence Learning, introduces a graph Transformer, which represents nodes as a concatenation of their embeddings and position embeddings. The node relationship represents the shortest path between the two, and combines the two into a relationship—— Increase self-focus.
- Rethinking Graph Transformers with Spectral Attention, introducing Spectral Attention Networks (SAN), these combine node features with learned positional encodings (computed from Laplacian feature vectors/values) Up, used as keys and queries in attention, attention values are edge features.
- GRPE: Relative Positional Encoding for Graph Transformer, introduces the graph relative position encoding Transformer, which combines graph-level position encoding with node information, edge-level position encoding with node information, and combine the two in attention to represent the graph.
- Global Self-Attention as a Replacement for Graph Convolution introduces Edge Augmented Transformer, an architecture that embeds nodes and edges separately and aggregates them in modified attention.
- Do Transformers Really Perform Badly for Graph Representation, introduces Microsoft's Graphormer, which took first place when it came out at OGB. The architecture uses node features as queries/keys/values in attention and combines their representation with centrality, spatial and edge encoding in the attention mechanism.
Recent research "Pure Transformers are Powerful Graph Learners" introduced TokenGT in the method, representing the input graph as a series of node and edge embeddings, that is, using regular Enhanced with intersection node identifiers and trainable type identifiers, without positional embeddings, and providing this sequence as input to Transformers, this method is very simple and at the same time very effective.
##Paper address: https://arxiv.org/pdf/2207.02505.pdf
In addition, in the study "Recipe for a General, Powerful, Scalable Graph Transformer", unlike other methods, it introduces not a model but a framework, called GraphGPS, which allows the message passing network to be combined with Linear (remote) Transformers combine to easily create hybrid networks. The framework also contains several tools for computing positional and structural encodings (node, graph, edge level), feature augmentation, random walks, etc.
Paper address: https://arxiv.org/abs/2205.12454
Use Transformer Graphs are still very much in their infancy, but for now they are very promising. They can alleviate some of the limitations of GNNs, such as scaling to larger or denser graphs, or without over-smoothing. Increase model size in case.
The above is the detailed content of Graph machine learning is everywhere, using Transformer to alleviate GNN limitations. For more information, please follow other related articles on the PHP Chinese website!
Related articles
See more- Technology trends to watch in 2023
- How Artificial Intelligence is Bringing New Everyday Work to Data Center Teams
- Can artificial intelligence or automation solve the problem of low energy efficiency in buildings?
- OpenAI co-founder interviewed by Huang Renxun: GPT-4's reasoning capabilities have not yet reached expectations
- Microsoft's Bing surpasses Google in search traffic thanks to OpenAI technology