

 Technology peripheralsAIUsing software visualization and transfer learning in software defect prediction
Using software visualization and transfer learning in software defect prediction

The motivation of the article is to avoid the intermediate representation of the source code, represent the source code as an image, and directly extract the semantic information of the code to improve the performance of defect prediction.
First, see the motivation example as shown below. Although both examples of File1.java and File2.java contain 1 if statement, 2 for statements and 4 function calls, the semantics and structural characteristics of the code are different. In order to verify whether converting source code into images can help distinguish different codes, the author conducted an experiment: map the source code to pixels according to the ASCII decimal number of the characters, arrange them into a pixel matrix, and obtain an image of the source code. The author points out that there are differences between different source code images.
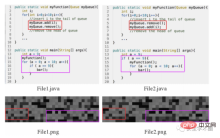
Fig. 1 Motivation Example
The main contributions of the article are as follows:
Convert the code into an image and extract semantic and structural information from it ;
Propose an end-to-end framework that combines self-attention mechanism and transfer learning to achieve defect prediction.
The model framework proposed in the article is shown in Figure 2, which is divided into two stages: source code visualization and deep transfer learning modeling.

Fig. 2 Framework
1. Source code visualization
The article converts the source code into 6 images, the process is shown in Figure 3 shown. Convert the decimal ASCII codes of the source code characters into 8-bit unsigned integer vectors, arrange these vectors by rows and columns, and generate an image matrix. 8-bit integers directly correspond to gray levels. In order to solve the problem of the small original data set, the author proposed a data set expansion method based on color enhancement in the article: the values of the three color channels of R, G, and B are arranged and combined to generate 6 color images. It looks very confusing here. After changing the channel value, the semantic and structural information should change, right? But the author explains it in a footnote, as shown in Figure 4.

Fig. 3 Source code visualization process

Fig. 4 Article footnote 2
2 .Deep transfer learning modeling
The article uses DAN network to capture the semantic and structural information of the source code. In order to enhance the model's ability to express important information, the author added an Attention layer to the original DAN structure. The training and testing process is shown in Figure 5, in which conv1-conv5 come from AlexNet, and four fully connected layers fc6-fc9 are used as classifiers. The author mentioned that for a new project, training a deep learning model requires a large amount of labeled data, which is difficult. Therefore, the author first trained a pre-trained model on ImageNet 2012, and used the parameters of the pre-trained model as initial parameters to fine-tune all convolutional layers, thereby reducing the difference between code images and images in ImageNet 2012.

Fig. 5 Training and testing process
3. Model training and prediction
For the tagged code and Target in the Source project The unlabeled code in the project generates code images and feeds them into the model at the same time; both share the convolutional layer and the Attention layer to extract their respective features. Calculate MK-MDD (Multi Kernel Variant Maximum Mean Discrepancy) between Source and Target in the fully connected layer. Since Target has no label, cross entropy is only calculated for Source. The model is trained along the loss function using mini-batch stochastic gradient descent. For each
In the experimental part, the author selected all open source Java projects in the PROMISE data warehouse and collected their version numbers, class names, and whether there were bug tags. Download the source code from github based on the version number and class name. Finally, data from 10 Java projects were collected. The data set structure is shown in Figure 6.
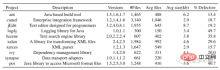
Fig. 6 Dataset structure
For intra-project defect prediction, the article selects the following baseline model for comparison:

For cross-project defect prediction, the article selects the following baseline model for comparison:

To summarize, although the paper was written two years ago, the idea is still relatively novel. , avoiding a series of code intermediate representations such as AST, and directly converting the code into image extraction features. But I am still confused. Does the image converted from the code really contain the semantic and structural information of the source code? It doesn’t feel very explainable, haha. We need to do some experimental analysis later.
The above is the detailed content of Using software visualization and transfer learning in software defect prediction. For more information, please follow other related articles on the PHP Chinese website!

 Are You At Risk Of AI Agency Decay? Take The Test To Find OutApr 21, 2025 am 11:31 AM
This article explores the growing concern of "AI agency decay"—the gradual decline in our ability to think and decide independently. This is especially crucial for business leaders navigating the increasingly automated world while retainin
 How to Build an AI Agent from Scratch? - Analytics VidhyaApr 21, 2025 am 11:30 AM
Ever wondered how AI agents like Siri and Alexa work? These intelligent systems are becoming more important in our daily lives. This article introduces the ReAct pattern, a method that enhances AI agents by combining reasoning an
 Revisiting The Humanities In The Age Of AIApr 21, 2025 am 11:28 AM
"I think AI tools are changing the learning opportunities for college students. We believe in developing students in core courses, but more and more people also want to get a perspective of computational and statistical thinking," said University of Chicago President Paul Alivisatos in an interview with Deloitte Nitin Mittal at the Davos Forum in January. He believes that people will have to become creators and co-creators of AI, which means that learning and other aspects need to adapt to some major changes. Digital intelligence and critical thinking Professor Alexa Joubin of George Washington University described artificial intelligence as a “heuristic tool” in the humanities and explores how it changes
 Understanding LangChain Agent FrameworkApr 21, 2025 am 11:25 AM
LangChain is a powerful toolkit for building sophisticated AI applications. Its agent architecture is particularly noteworthy, allowing developers to create intelligent systems capable of independent reasoning, decision-making, and action. This expl
 What are the Radial Basis Functions Neural Networks?Apr 21, 2025 am 11:13 AM
Radial Basis Function Neural Networks (RBFNNs): A Comprehensive Guide Radial Basis Function Neural Networks (RBFNNs) are a powerful type of neural network architecture that leverages radial basis functions for activation. Their unique structure make
 The Meshing Of Minds And Machines Has ArrivedApr 21, 2025 am 11:11 AM
Brain-computer interfaces (BCIs) directly link the brain to external devices, translating brain impulses into actions without physical movement. This technology utilizes implanted sensors to capture brain signals, converting them into digital comman
 Insights on spaCy, Prodigy and Generative AI from Ines MontaniApr 21, 2025 am 11:01 AM
This "Leading with Data" episode features Ines Montani, co-founder and CEO of Explosion AI, and co-developer of spaCy and Prodigy. Ines offers expert insights into the evolution of these tools, Explosion's unique business model, and the tr
 A Guide to Building Agentic RAG Systems with LangGraphApr 21, 2025 am 11:00 AM
This article explores Retrieval Augmented Generation (RAG) systems and how AI agents can enhance their capabilities. Traditional RAG systems, while useful for leveraging custom enterprise data, suffer from limitations such as a lack of real-time dat


Hot AI Tools

Undresser.AI Undress
AI-powered app for creating realistic nude photos

AI Clothes Remover
Online AI tool for removing clothes from photos.

Undress AI Tool
Undress images for free

Clothoff.io
AI clothes remover

Video Face Swap
Swap faces in any video effortlessly with our completely free AI face swap tool!

Hot Article
Hot Tools

mPDF
mPDF is a PHP library that can generate PDF files from UTF-8 encoded HTML. The original author, Ian Back, wrote mPDF to output PDF files "on the fly" from his website and handle different languages. It is slower than original scripts like HTML2FPDF and produces larger files when using Unicode fonts, but supports CSS styles etc. and has a lot of enhancements. Supports almost all languages, including RTL (Arabic and Hebrew) and CJK (Chinese, Japanese and Korean). Supports nested block-level elements (such as P, DIV),

SecLists
SecLists is the ultimate security tester's companion. It is a collection of various types of lists that are frequently used during security assessments, all in one place. SecLists helps make security testing more efficient and productive by conveniently providing all the lists a security tester might need. List types include usernames, passwords, URLs, fuzzing payloads, sensitive data patterns, web shells, and more. The tester can simply pull this repository onto a new test machine and he will have access to every type of list he needs.

VSCode Windows 64-bit Download
A free and powerful IDE editor launched by Microsoft

Dreamweaver CS6
Visual web development tools

MantisBT
Mantis is an easy-to-deploy web-based defect tracking tool designed to aid in product defect tracking. It requires PHP, MySQL and a web server. Check out our demo and hosting services.

