Home >Technology peripherals >AI >E-commerce data mining based on machine learning | Data exploration
E-commerce data mining based on machine learning | Data exploration
- 王林forward
- 2023-04-11 23:31:011196browse
This article is reproduced from the WeChat public account "Youerhut", author Youerhut. To reprint this article, please contact the Youerhut public account.
Hello everyone, I am Peter~
I recently obtained a piece of IC electronic product e-commerce data, and will conduct data analysis and mining on 3 topics later:
- The first stage: Statistical visualization analysis based on pandas, numpy, matplotlib, seaborn, plotly and other libraries
- The second stage: User portrait analysis based on machine learning clustering algorithm and RFM model
- The third stage: Brand, product and product category correlation mining based on association rule algorithm
This article is the first stage, the main content includes:
- Data Preparation Processing
- Data exploration EDA
- Multi-angle comparative analysis

import pandas as pd
import numpy as np

import time
import os
from datetime import datetime
import matplotlib.pyplot as plt
import seaborn as sns
%matplotlib inline
#设置中文编码和负号的正常显示
plt.rcParams['font.sans-serif']=['SimHei']
plt.rcParams['axes.unicode_minus']=False

import plotly_express as px
import plotly.graph_objects as go

import missingno as ms

from sklearn.cluster import KMeans
from sklearn.preprocessing import MinMaxScaler
Basic data informationReading data
df = pd.read_csv(
"ic_sale.csv",
 encoding="utf-8",# 指定编码
 cnotallow={"order_id":str,"product_id":str,"category_id":str,"user_id":str} # 指定字段类型
)
df.head()
The role of the converters parameter: multiple id fields in the data are all numbers. csv or excel files are treated as numbers (expressed in scientific notation); essentially they are "string" information without any size meaning. You need to specify the type when reading.

# 1、数据shape

df.shape
Out[3]:
(564169, 11)In [4]:
# 2、数据字段类型

df.dtypes
Out[4]:
event_timeobject
order_idobject
product_idobject
category_id object
category_code object
brand object
pricefloat64
user_id object
ageint64
sex object
local object
dtype: object
In [5]:Descriptive statistical information is for numeric fields:
# 3、数据描述统计信息

df.describe()
Out[5]:
| ##age | ||||
| 564169.000000 | 564169.000000 | |||
##208.269324 |
##33.184388 | std | 304.559875 |
10.122088 |
min |
0.000000 |
16.000000 |
||
25% |
23.130000 |
24.000000 |
||
50% |
87.940000 |
33.000000 |
||
75% |
277.750000 |
42.000000 |
||
max |
18328.680000 |
50.000000 |
In [6]:
# 4、总共多少个不同客户

df["user_id"].nunique()
Out[6]:
6908
In [7]:
# 5、总共多少个不同品牌

df["brand"].nunique()
Out[7]:
868
In [8]:
# 6、总共多少个订单

df["order_id"].nunique()
Out[8]:
234232
In [9]:
# 7、总共多少个产品

df["product_id"].nunique()
Out[9]:
3756
数据预处理
数据筛选
从描述统计信息中发现price字段的最小值是0,应该是没有成交的数据;我们选择price大于0的信息:
In [10]:
df = df[df["price"] > 0]
缺失值处理
缺失值情况
In [11]:
df.isnull().sum()
Out[11]:
event_time0
order_id0
product_id0
category_id 0
category_code129344
brand 27215
price 0
user_id 0
age 0
sex 0
local 0
dtype: int64
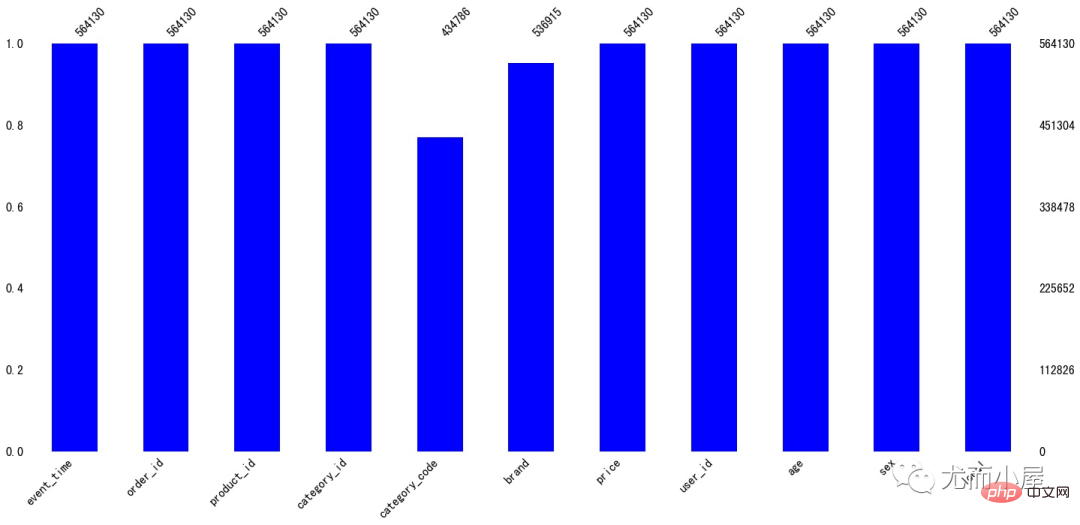
可以看到缺失值体现在字段:
- category_code:类别
- brand:品牌
In [12]:
ms.bar(df,color="blue")# 缺失值可视化

plt.show()
缺失值填充
In [13]:
df.fillna("missing",inplace=True)In [14]:
df.isnull().sum()# 填充之后无缺失值
Out[14]:
event_time 0
order_id 0
product_id 0
category_id0
category_code0
brand0
price0
user_id0
age0
sex0
local0
dtype: int64
时间字段处理
字段类型转化
读进来的数据中时间字段是object类型,需要将其转成时间格式的类型
In [15]:
df["event_time"][:5] # 处理前
Out[15]:
02020-04-24 11:50:39 UTC
12020-04-24 11:50:39 UTC
22020-04-24 14:37:43 UTC
32020-04-24 14:37:43 UTC
42020-04-24 19:16:21 UTC
Name: event_time, dtype: object
In [16]:
# 去掉最后的UTC
df["event_time"] = df["event_time"].apply(lambda x: x[:19])
In [17]:
# 时间数据类型转化:字符类型---->指定时间格式

df['event_time'] = pd.to_datetime(df['event_time'], format="%Y-%m-%d %H:%M:%S")
字段衍生
In [18]:
# 提取多个时间相关字段

df['month']=df['event_time'].dt.month
df['day'] = df['event_time'].dt.day
df['dayofweek']=df['event_time'].dt.dayofweek
df['hour']=df['event_time'].dt.hour
In [19]:
df["event_time"][:5] # 处理后
Out[19]:
0 2020-04-24 11:50:39
1 2020-04-24 11:50:39
2 2020-04-24 14:37:43
3 2020-04-24 14:37:43
4 2020-04-24 19:16:21
Name: event_time, dtype: datetime64[ns]
可以看到字段类型已经发生了变化
整体趋势分析
分析1:每月成交金额多少?
In [20]:
amount_by_month = df.groupby("month")["price"].sum().reset_index()
amount_by_month
Out[20]:
month |
price |
|
0 |
1 |
1953358.17 |
1 |
2 |
2267809.88 |
2 |
3 |
2897486.26 |
3 |
4 |
1704422.41 |
4 |
5 |
7768637.79 |
5 |
6 |
7691244.33 |
6 |
7 |
16354029.27 |
7 |
8 |
27982605.44 |
8 |
9 |
17152310.57 |
9 |
10 |
19765680.76 |
10 |
11 |
11961511.52 |
In [21]:
fig = px.scatter(amount_by_month,x="month",y="price",size="price",color="price")

fig.update_layout(height=500, width=1000, title_text="每月成交金额")

fig.show()
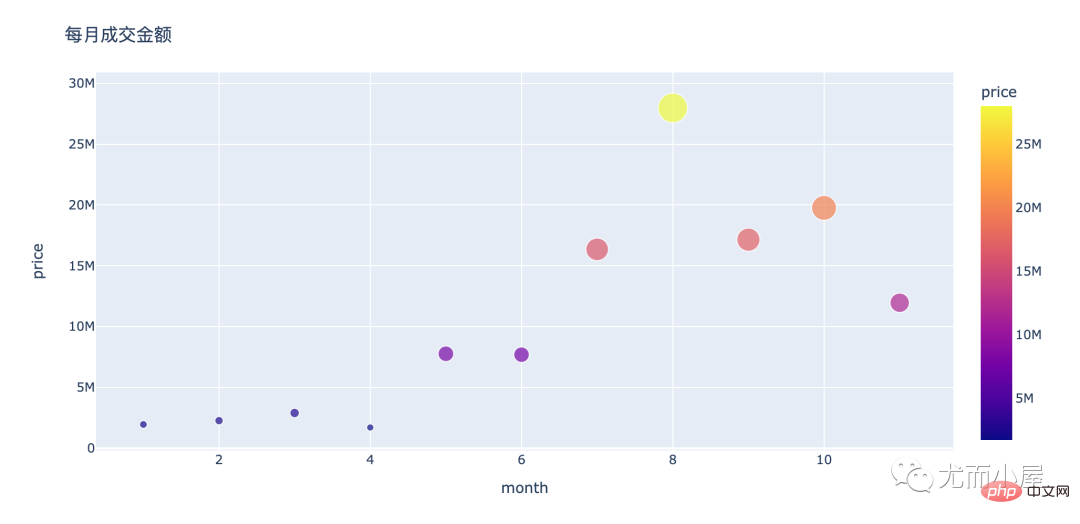
可以看到:
- 8月份是整个销售的顶峰
- 下半年的整体销售会好于下半年
分析2:月订单量如何变化?
In [22]:
order_by_month = df.groupby("month")["order_id"].nunique().reset_index()
order_by_month
Out[22]:
month |
order_id |
|
0 |
1 |
10353 |
1 |
2 |
11461 |
2 |
3 |
12080 |
3 |
4 |
9001 |
4 |
5 |
30460 |
5 |
6 |
28978 |
6 |
7 |
57659 |
7 |
8 |
73897 |
8 |
9 |
345 |
9 |
10 |
14 |
10 |
11 |
6 |
In [23]:
fig = px.line(order_by_month,x="month",y="order_id")

fig.update_layout(height=500, width=1000, title_text="每月成交订单量")

fig.show()
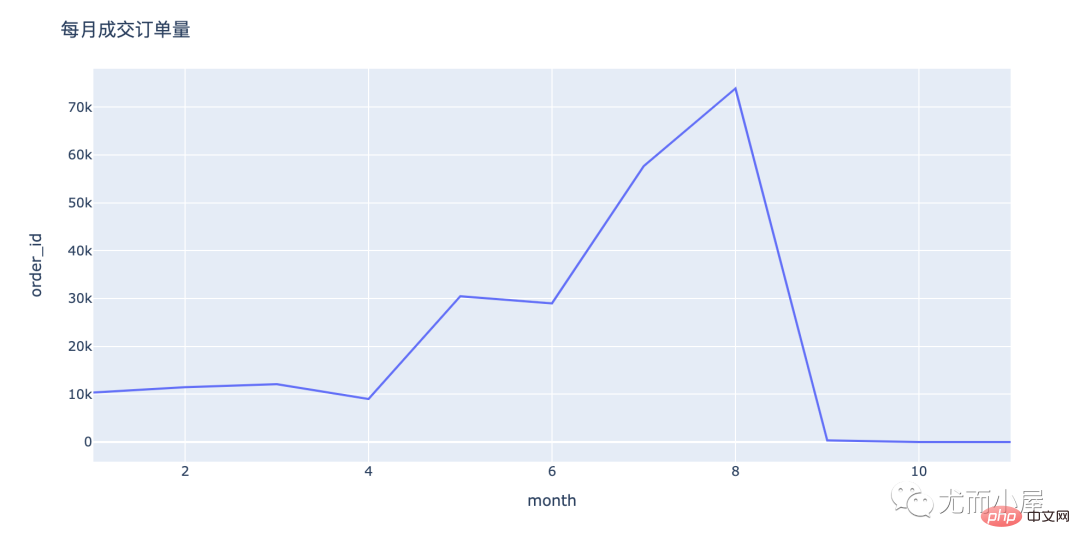
关于订单量:
- 从1到8月份是一个逐渐上升的趋势;尤其是4到8月份;可能是五一假期或者暑假、开学季引起的
- 9、10月份订单量陡降:开学之后销量下降快
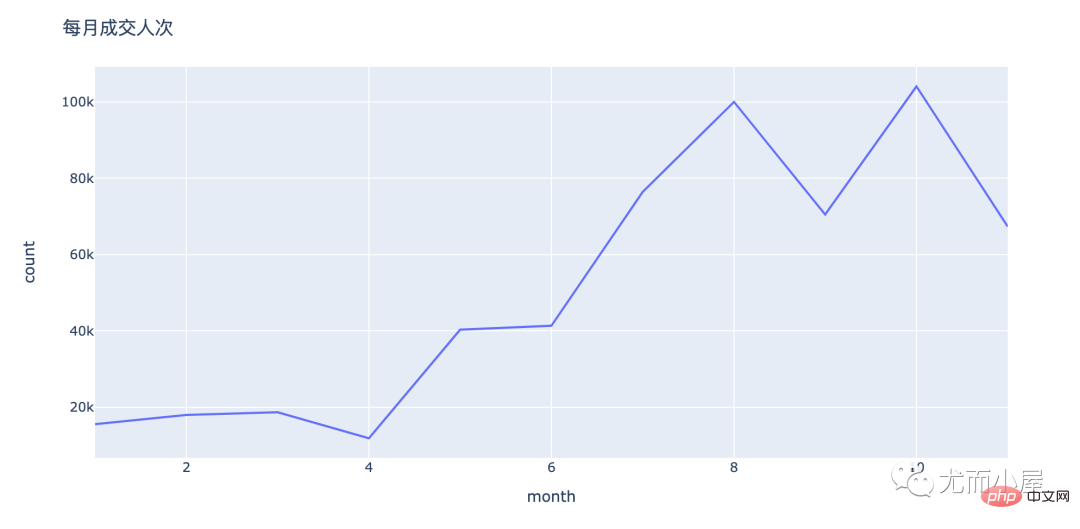
分析3:月消费人数/人次如何变化?
In [24]:
# nunique:对每个user_id进行去重:消费人数
# count:统计user_id 的次数;消费人次(存在一人多次购买)

people_by_month = df.groupby("month")["user_id"].agg(["nunique","count"]).reset_index()
people_by_month
Out[24]:
month |
nunique |
count |
|
0 |
1 |
1388 |
15575 |
1 |
2 |
1508 |
17990 |
2 |
3 |
1597 |
18687 |
3 |
4 |
1525 |
11867 |
4 |
5 |
3168 |
40332 |
5 |
6 |
3966 |
41355 |
6 |
7 |
5159 |
76415 |
7 |
8 |
6213 |
100006 |
8 |
9 |
5497 |
70496 |
9 |
10 |
4597 |
104075 |
10 |
11 |
3134 |
67332 |
In [25]:
fig = px.line(people_by_month,x="month",y="nunique")

fig.update_layout(height=500, width=1000, title_text="每月成交人数")

fig.show()
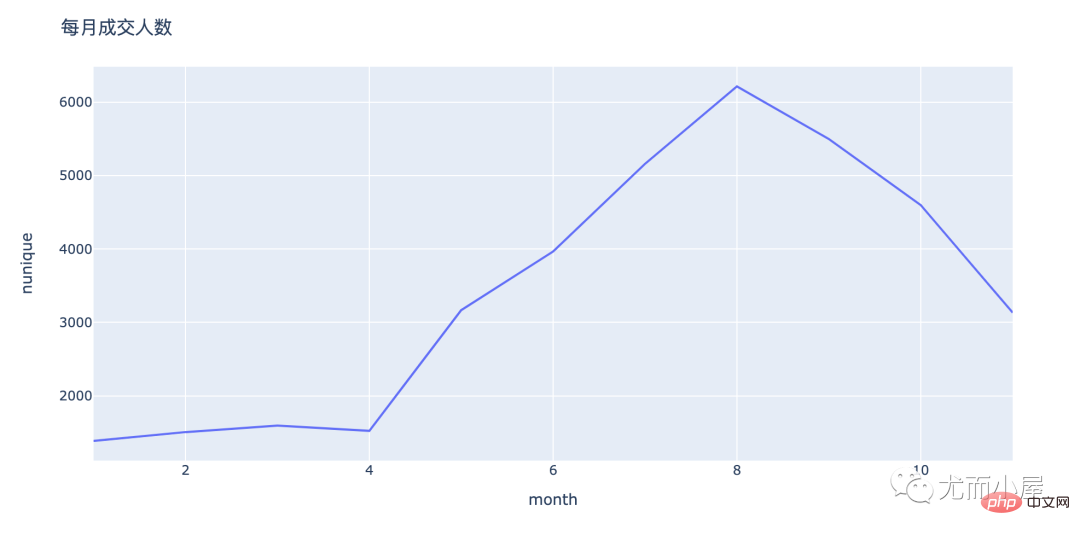
fig = px.line(people_by_month,x="month",y="count")

fig.update_layout(height=500, width=1000, title_text="每月成交人次")

fig.show()
分析4:每月订单价多少?
In [27]:
amount_by_month# 每月成交金额
Out[27]:
month |
price |
|
0 |
1 |
1953358.17 |
1 |
2 |
2267809.88 |
2 |
3 |
2897486.26 |
3 |
4 |
1704422.41 |
4 |
5 |
7768637.79 |
5 |
6 |
7691244.33 |
6 |
7 |
16354029.27 |
7 |
8 |
27982605.44 |
8 |
9 |
17152310.57 |
9 |
10 |
19765680.76 |
10 |
11 |
11961511.52 |
In [28]:
order_by_month# 每月订单数
Out[28]:
month |
order_id |
|
0 |
1 |
10353 |
1 |
2 |
11461 |
2 |
3 |
12080 |
3 |
4 |
9001 |
4 |
5 |
30460 |
5 |
6 |
28978 |
6 |
7 |
57659 |
7 |
8 |
73897 |
8 |
9 |
345 |
9 |
10 |
14 |
10 |
11 |
6 |
In [29]:
amount_by_userid = pd.merge(amount_by_month,order_by_month)

amount_by_userid
Out[29]:
month |
price |
order_id |
|
0 |
1 |
1953358.17 |
10353 |
1 |
2 |
2267809.88 |
11461 |
2 |
3 |
2897486.26 |
12080 |
3 |
4 |
1704422.41 |
9001 |
4 |
5 |
7768637.79 |
30460 |
5 |
6 |
7691244.33 |
28978 |
6 |
7 |
16354029.27 |
57659 |
7 |
8 |
27982605.44 |
73897 |
8 |
9 |
17152310.57 |
345 |
9 |
10 |
19765680.76 |
14 |
10 |
11 |
11961511.52 |
6 |
In [30]:
amount_by_userid["average"] = amount_by_userid["price"] / amount_by_userid["order_id"]

amount_by_userid
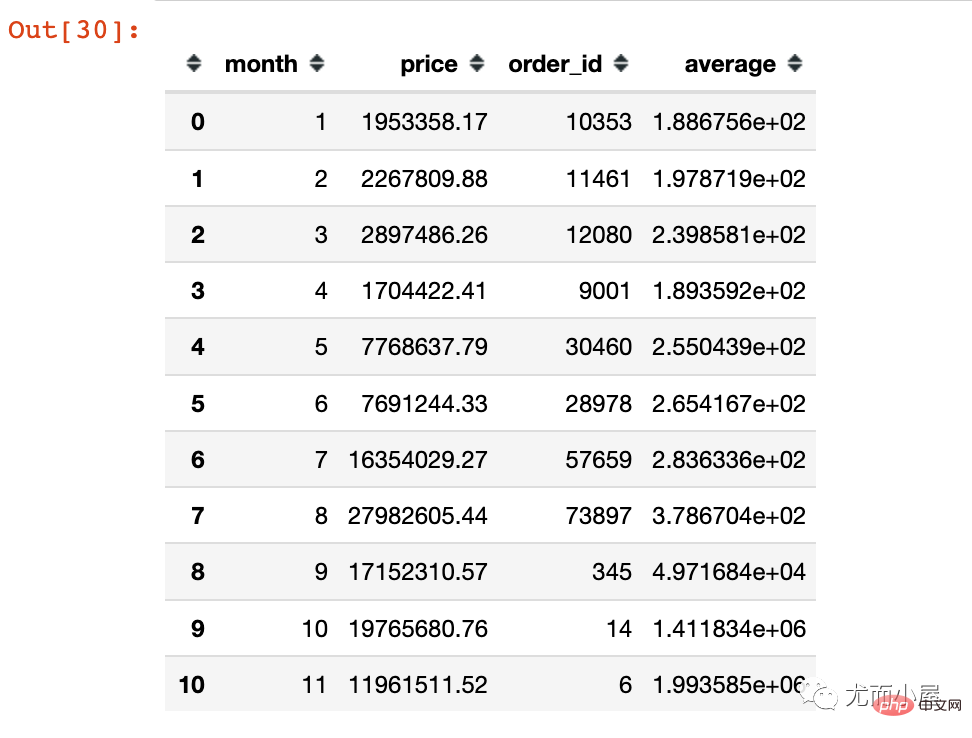
fig = px.line(amount_by_userid,x="month",y="average")

fig.update_layout(height=500, width=1000, title_text="每月客单价")

fig.show()
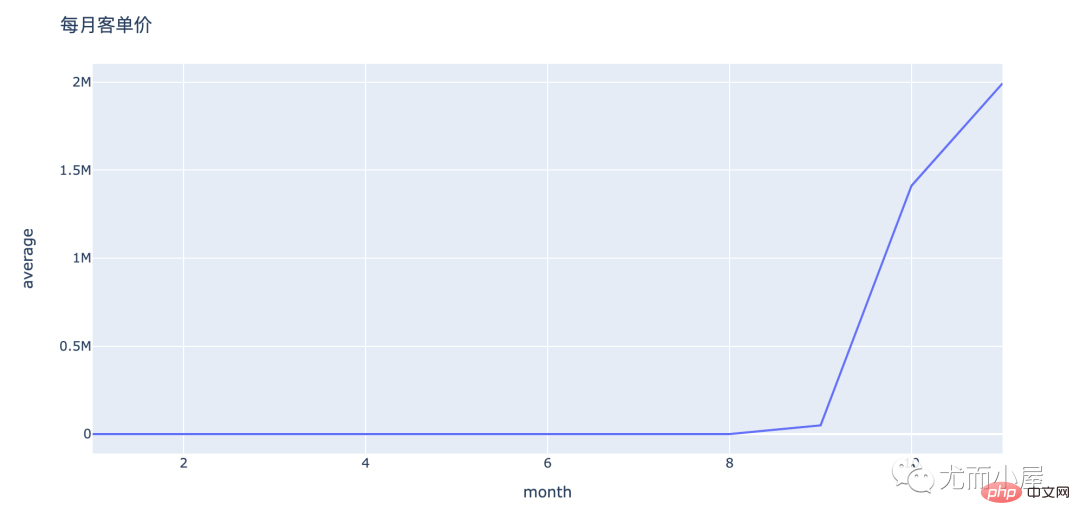
从上面的折线图可以看出来:
- 1到8月份月订单量基本持平;可能是有很多批量的订单;通过量大带来利润:量的路线
- 9到10月份:月单价急剧上升;订单量少,但是金额;可能存在大额消费的用户:质的路线
分析5:每个订单包含多少产品
In [32]:
product_by_order = df.groupby("order_id")["product_id"].count().reset_index().sort_values("product_id",ascending=False)

product_by_order.head(10)
Out[32]:
order_id |
product_id |
|
234208 |
2388440981134640000 |
15021 |
234210 |
2388440981134660000 |
14891 |
234211 |
2388440981134670000 |
14845 |
234212 |
2388440981134680000 |
14765 |
234202 |
2388440981134580000 |
14587 |
234205 |
2388440981134610000 |
14571 |
234207 |
2388440981134630000 |
14443 |
234204 |
2388440981134600000 |
14416 |
234206 |
2388440981134620000 |
14414 |
234203 |
2388440981134590000 |
14194 |
In [33]:
fig = px.bar(product_by_order[:20],
 x="order_id",
 y="product_id",
 text="product_id"
)

fig.show()
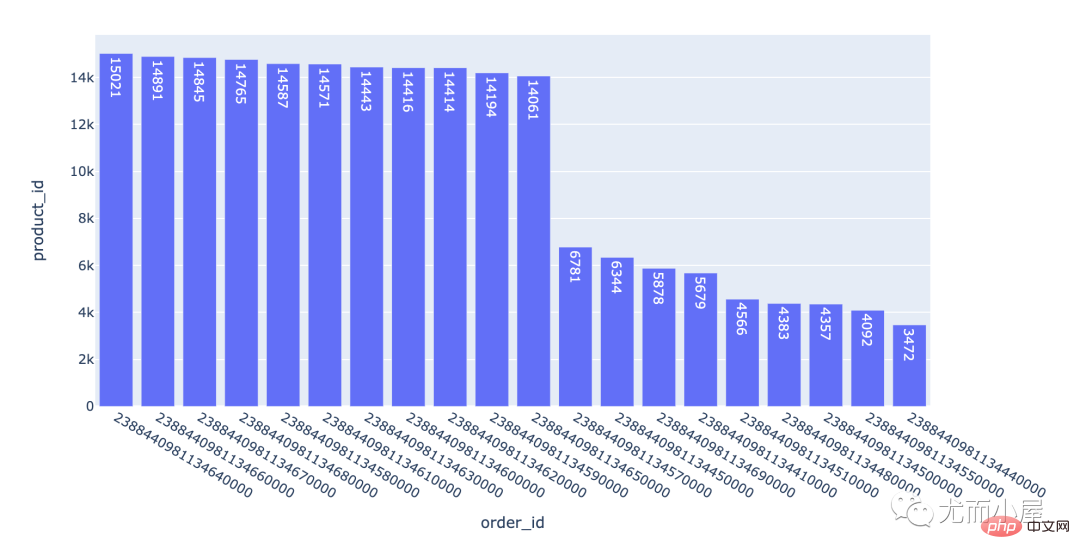
一个订单下包含的产品数量是不同;上万的订单可能是小型的ic元器件产品。
不同省份对比
分析6:订单量、用户量和成交金额对比
不同省份下的订单量、用户量和成交金额对比
In [34]:
local = df.groupby("local").agg({"order_id":"nunique","user_id":"nunique","price":sum}).reset_index()
local.head()
Out[34]:
local |
order_id |
user_id |
price |
||||||||||||||||||||||||||||||||||||||||||||||||||||||||||||||||||||||||||||||||||||||||||||||||||||||||||||||||||||
0 |
上海 |
39354 |
5680 |
19837942.20 |
|||||||||||||||||||||||||||||||||||||||||||||||||||||||||||||||||||||||||||||||||||||||||||||||||||||||||||||||||||
1 |
北京 |
38118 |
5702 |
19137748.75 |
|||||||||||||||||||||||||||||||||||||||||||||||||||||||||||||||||||||||||||||||||||||||||||||||||||||||||||||||||||
2 |
Sichuan |
13396 |
3589 |
6770891.28 |
|||||||||||||||||||||||||||||||||||||||||||||||||||||||||||||||||||||||||||||||||||||||||||||||||||||||||||||||||||
| ##3 | Tianjin | 13058 | 3497 | ##6433736.85||||||||||||||||||||||||||||||||||||||||||||||||||||||||||||||||||||||||||||||||||||||||||||||||||||||||||||||||||||
| Guangdong | 51471 | ##6085 | 26013770.86 |
local |
order_id |
user_id |
price |
||||||||||||||||||||||||||||||||||||||||||||||||||||||||||
6 |
浙江 |
12790 |
3485 |
6522657.59 |
|||||||||||||||||||||||||||||||||||||||||||||||||||||||||
8 |
湖北 |
12810 |
3488 |
5993820.57 |
|||||||||||||||||||||||||||||||||||||||||||||||||||||||||
3 |
天津 |
13058 |
3497 |
##6433736.85 | |||||||||||||||||||||||||||||||||||||||||||||||||||||||||
| 10 | Chongqing | 13058 | 3496 | 6479488.14 | |||||||||||||||||||||||||||||||||||||||||||||||||||||||||
| 7 | Hainan | 13076 | 3587 | ##6968674.41||||||||||||||||||||||||||||||||||||||||||||||||||||||||||
| 四川 | ##13396 | 3589 | 6770891.28 |
||||||||||||||||||||||||||||||||||||||||||||||||||||||||||
| ##5 | 江苏 | 13575 | 3598 | ##6357286.87||||||||||||||||||||||||||||||||||||||||||||||||||||||||||
| Hunan | 13879 | 3481 | 6983078.88 | ||||||||||||||||||||||||||||||||||||||||||||||||||||||||||
| Beijing | 38118 | 5702 | ##19137748.75 |
##0 | 上海 |
##39354 | ##5680##19837942.20 | ||||||||||||||||||||||||||||||||||||||||||||||||||||||
| Guangdong | 51471 | 6085 | ##26013770.86 |
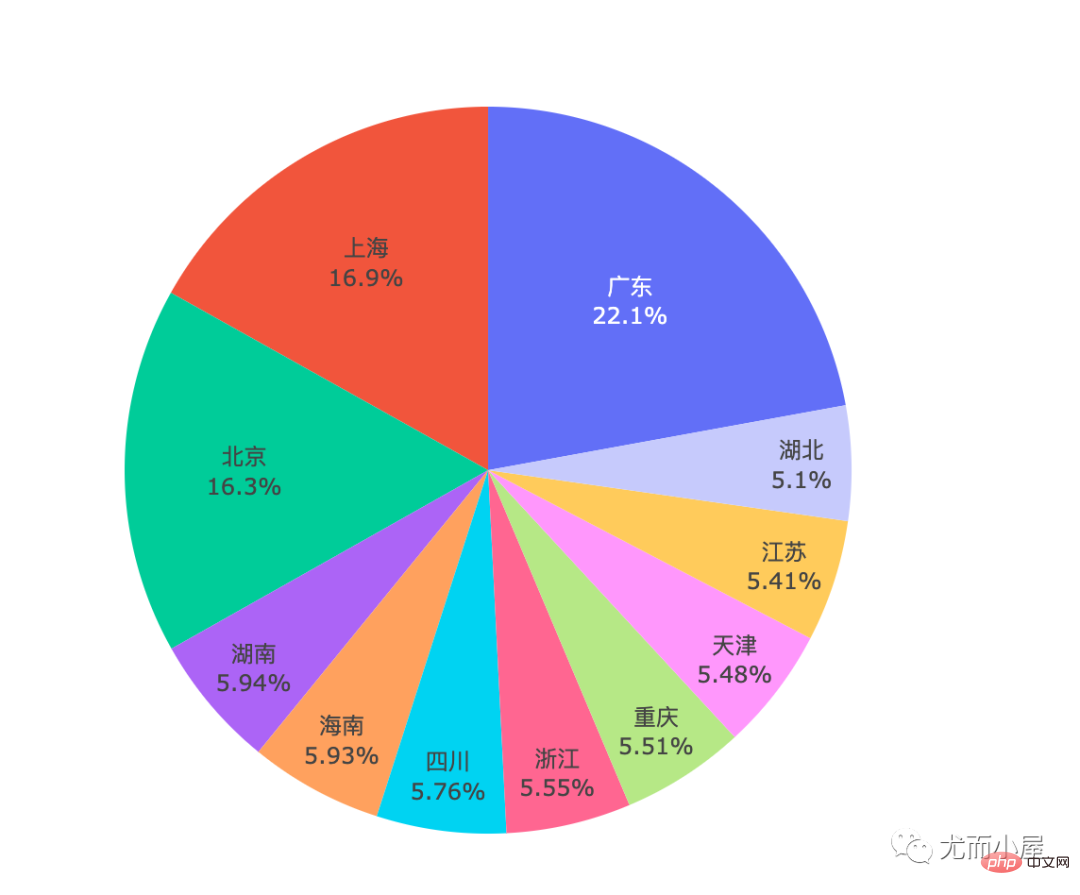
In [36]: fig = px.pie(df1, names="local",labels="local",values="price") fig.update_traces( textpositinotallow="inside", textinfo="percent+label" ) fig.show()
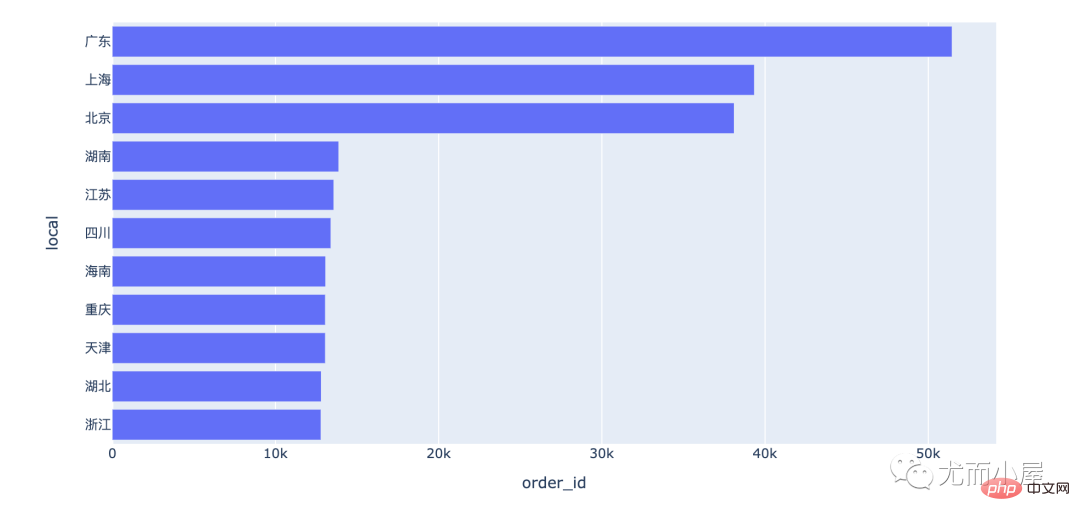
无疑:广东省No.1 每个省份的订单量对比: fig = px.bar(df1,x="order_id",y="local",orientatinotallow="h") fig.show()
# 整体的可视化效果

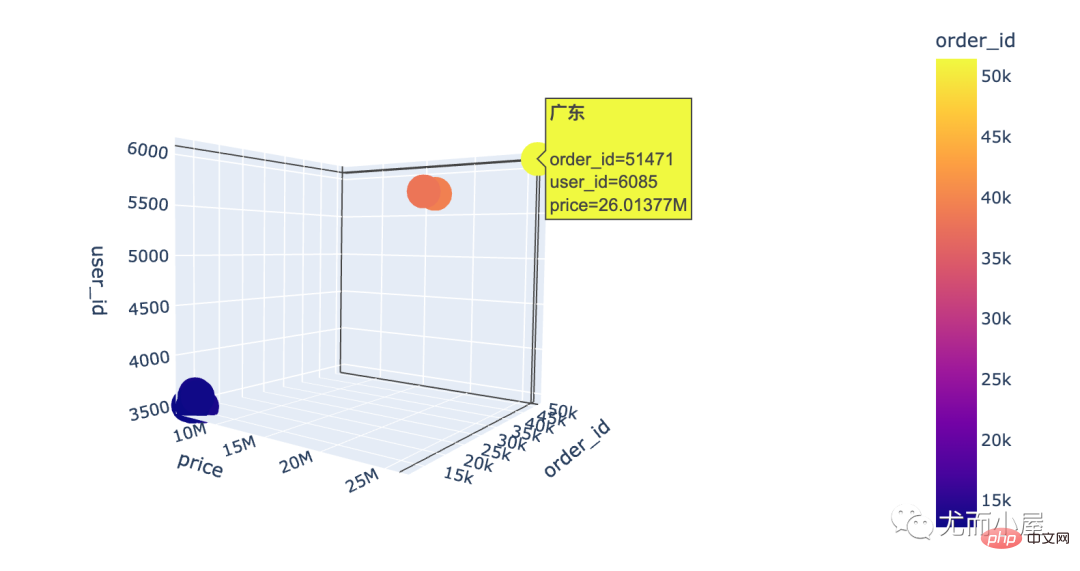
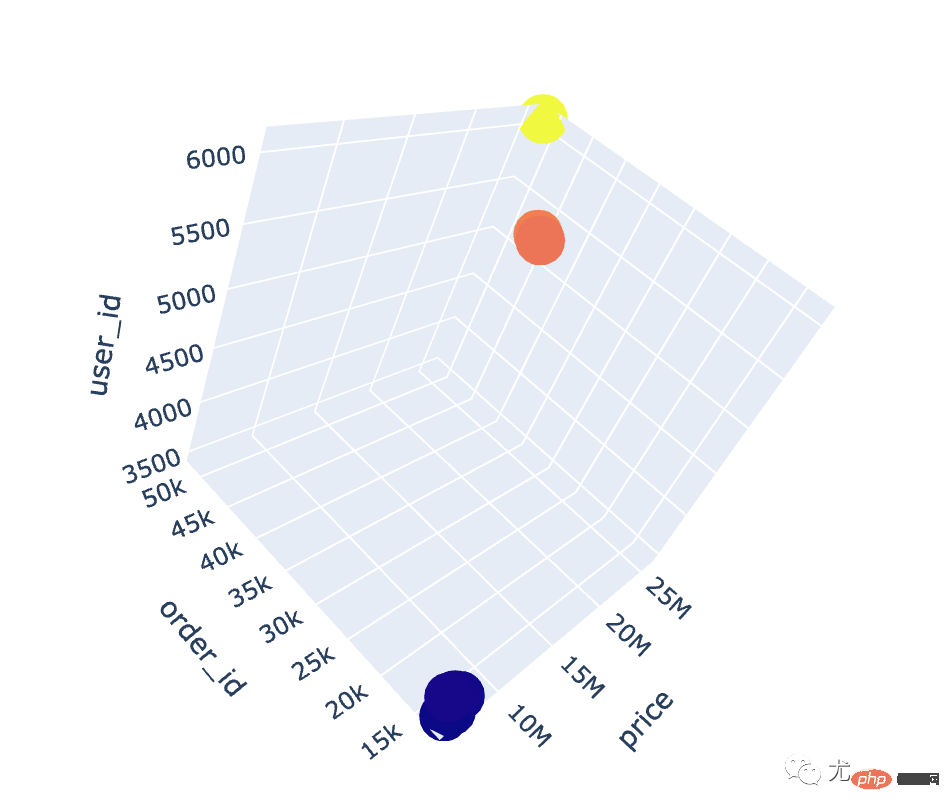
fig = px.scatter_3d(local,
x="order_id",
y="user_id",
z="price",
color="order_id",
hover_name="local"
 )

fig.show()
通过3D散点图我们发现:广东省真的是一骑绝尘!
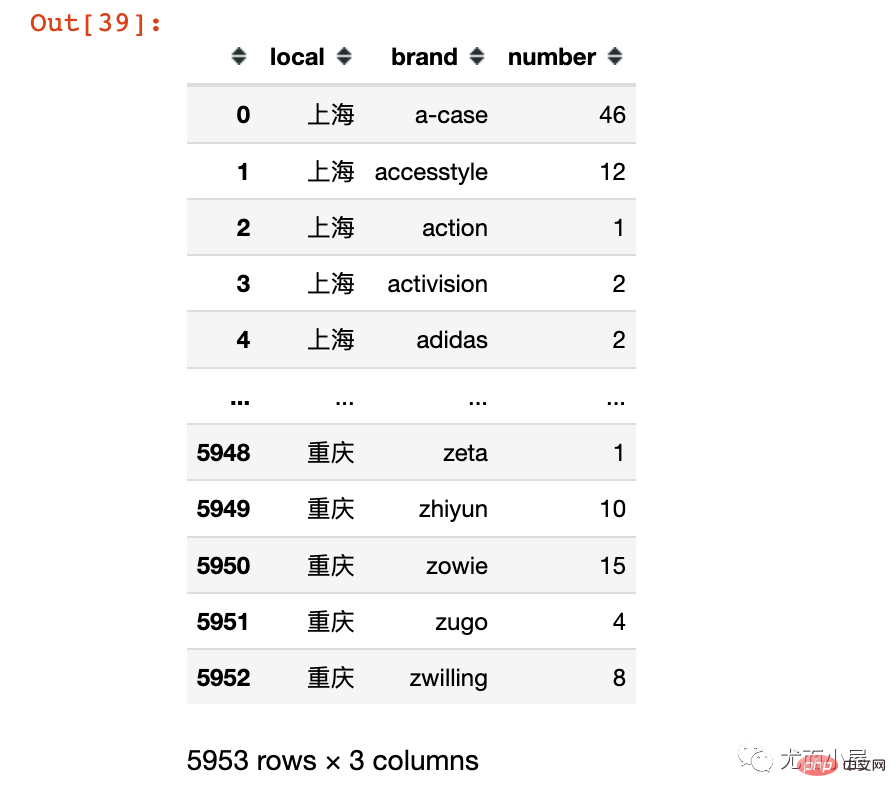
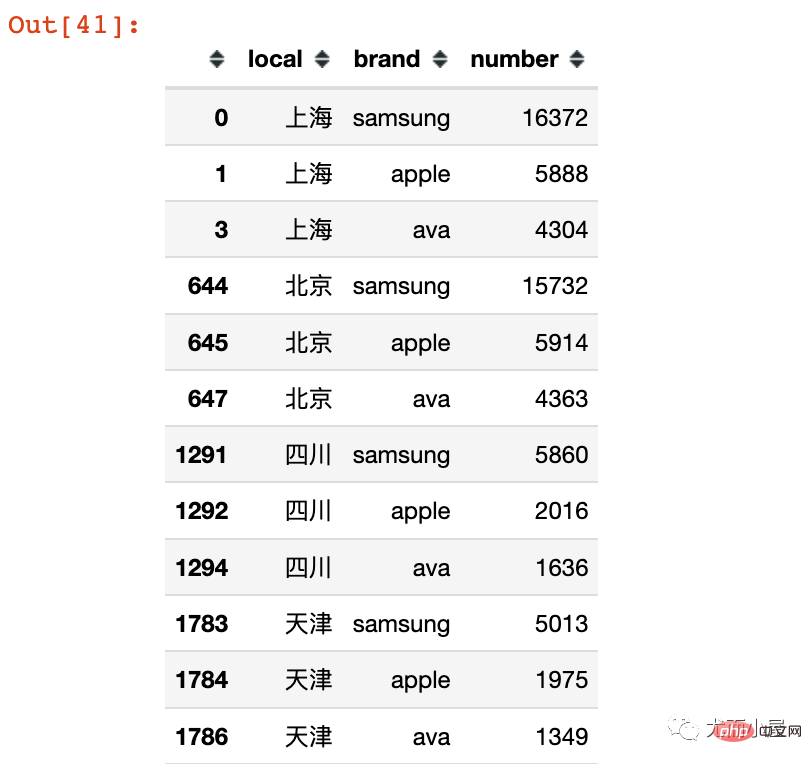
分析7:不同省份的客户钟爱哪些品牌?In [39]: local_brand = df.groupby(["local","brand"]).size().to_frame().reset_index() local_brand.columns = ["local","brand","number"]# 修改字段名 local_brand
# 根据local和number进行排序
local_brand.sort_values(["local","number"],ascending=[True,False],inplace=True,ignore_index=True)
local_brand = local_brand[local_brand["brand"] != "missing"]
# 每个local下面最受欢迎的前3个品牌
local_brand = local_brand.groupby("local").head(3)
local_brand
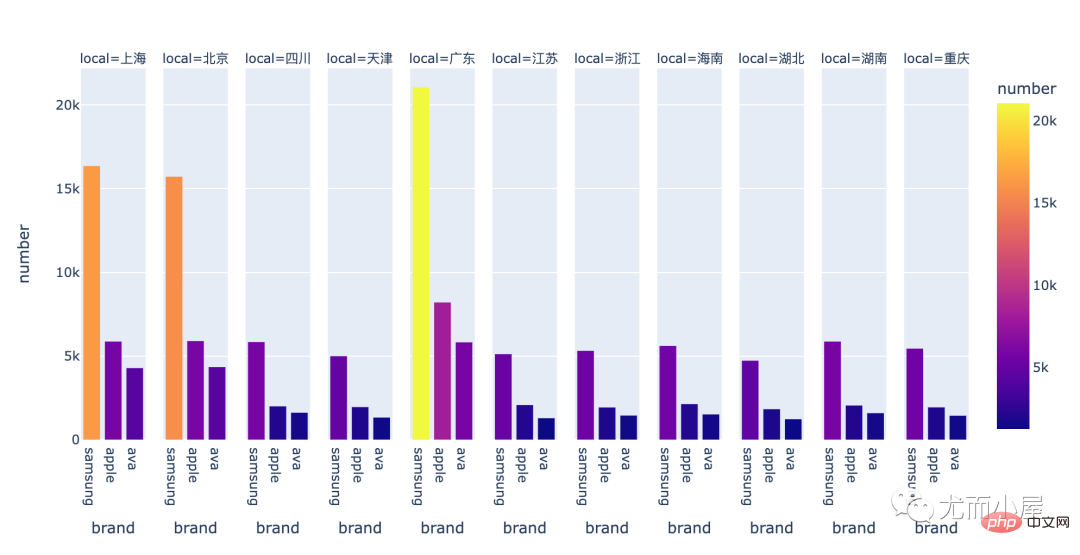
fig = px.bar(local_brand,
 x="brand",
 y="number",
 color="number",
 facet_col="local")

fig.update_layout(height=500,width=1000)

fig.show()
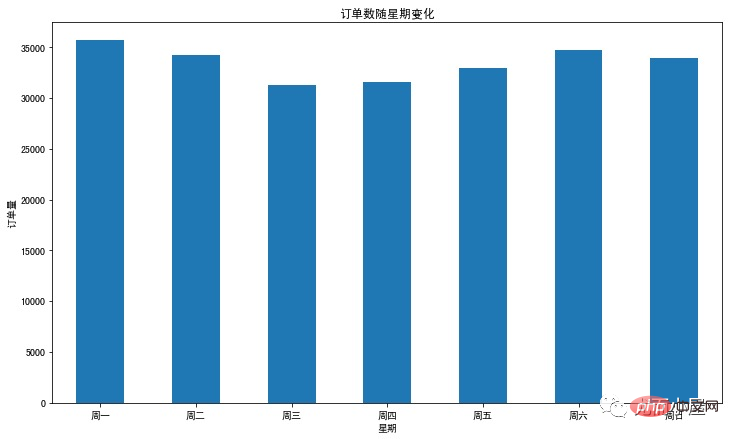
看来大家都很喜欢: samsung 、apple、ava 不同时间对比分析8:下单时间对比In [43]: df.columns Out[43]: Index(['event_time', 'order_id', 'product_id', 'category_id', 'category_code', 'brand', 'price', 'user_id', 'age', 'sex', 'local', 'month', 'day', 'dayofweek', 'hour'], dtype='object') In [44]: df2 = df.groupby("dayofweek")["order_id"].nunique().reset_index()
df2Out[44]:
In [45]: plt.figure(figsize=(12,7))
df2["order_id"].plot.bar()
plt.xticks(range(7),['周一','周二','周三','周四','周五','周六','周日'],rotatinotallow=0)
plt.xlabel('星期')
plt.ylabel('订单量')
plt.title('订单数随星期变化')
plt.show()
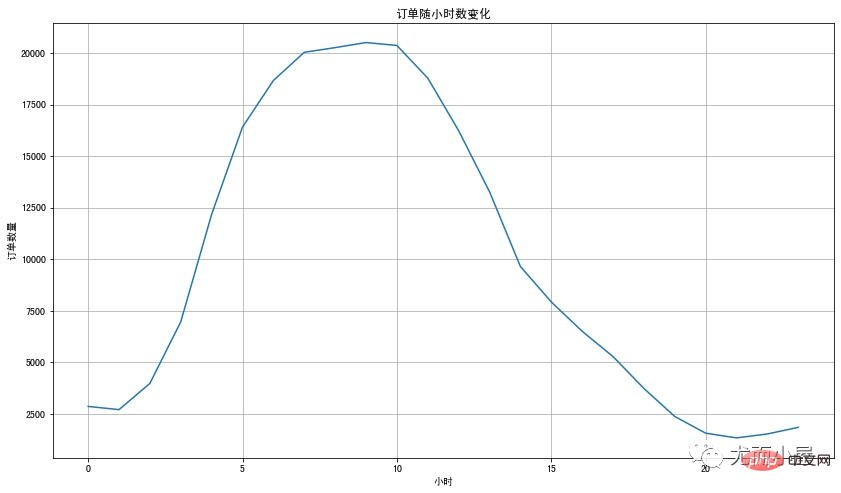
分析9:每小时订单量In [46]: df3 = df.groupby("hour")["order_id"].nunique().reset_index()
df3.head(10)Out[46]:
In [47]: plt.figure(figsize=(14,8))
df3["order_id"].plot()
plt.xlabel('小时')
plt.ylabel('订单数量')
plt.title('订单随小时数变化')
plt.grid()
plt.show()
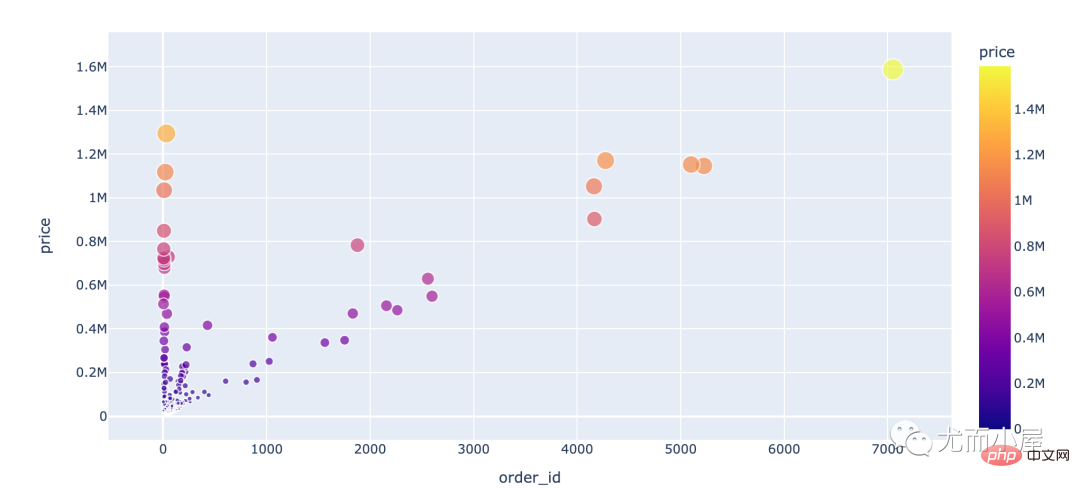
用户都喜欢在上午8、9、10点下单;可能是刚开始上班工作,大家更积极 不同用户消费行为分析分析10:消费次数和消费金额In [48]: df4 = df.groupby("user_id").agg({"order_id":"nunique", "price":sum})
fig = px.scatter(df4,
x="order_id",
y="price",
color="price",
size="price")
fig.show()
分析11:用户消费周期In [50]: # 用户消费周期
# shift函数:移动一个单位
purchase_time=df.groupby('user_id').apply(lambda x: x['event_time'] - x['event_time'].shift()).dt.days
purchase_timeOut[50]: user_id 151591562543995000096014NaN 1515915625440030000374760 NaN 48492735.0 1515915625440050000463812 NaN 473430 1.0 ... 1515915625514880000564132 0.0 564143 0.0 564164 0.0 1515915625514890000564158 NaN 564165 0.0 Name: event_time, Length: 564130, dtype: float64 In [51]: purchase_time[purchase_time>0].describe() Out[51]: count120629.000000 mean 35.494500 std 663.803583 min 1.000000 25% 2.000000 50% 4.000000 75%12.000000 max 18466.000000 Name: event_time, dtype: float64 说明:
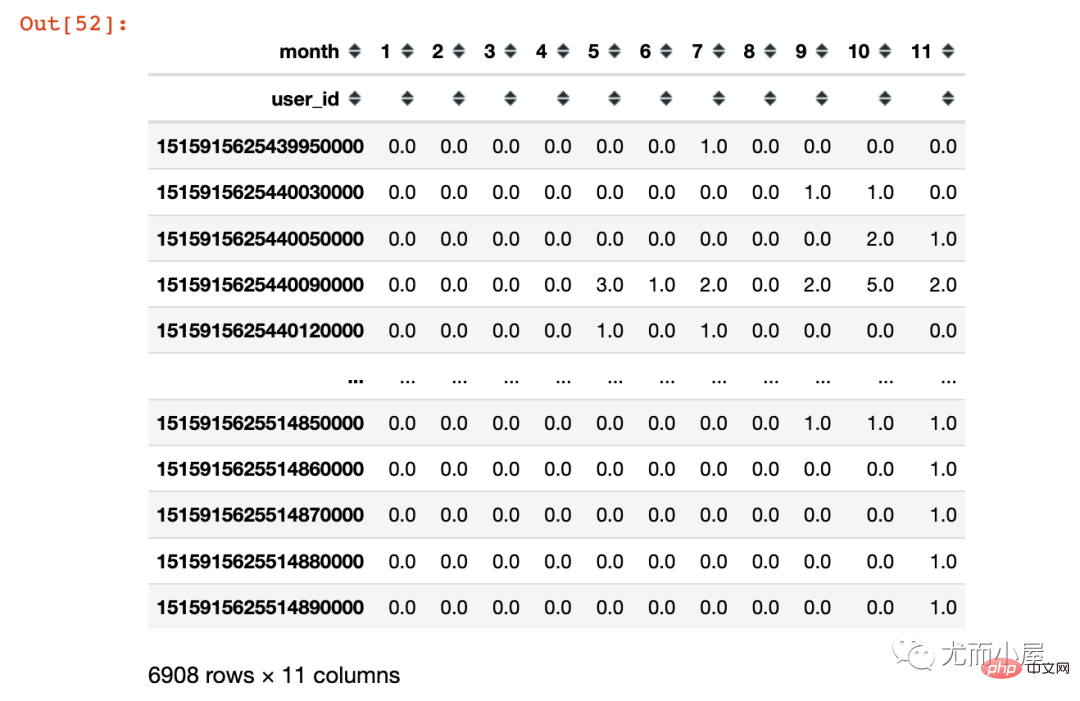
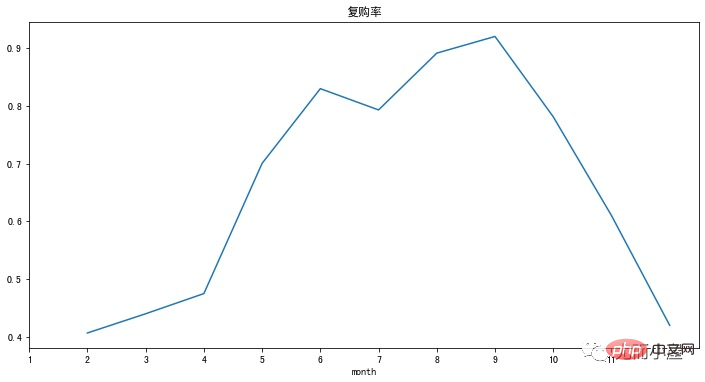
分析12:用户复购行为In [52]: pivoted_counts = df.pivot_table(index='user_id', columns='month', values='order_id', aggfunc='nunique').fillna(0) pivoted_counts Out[52]:
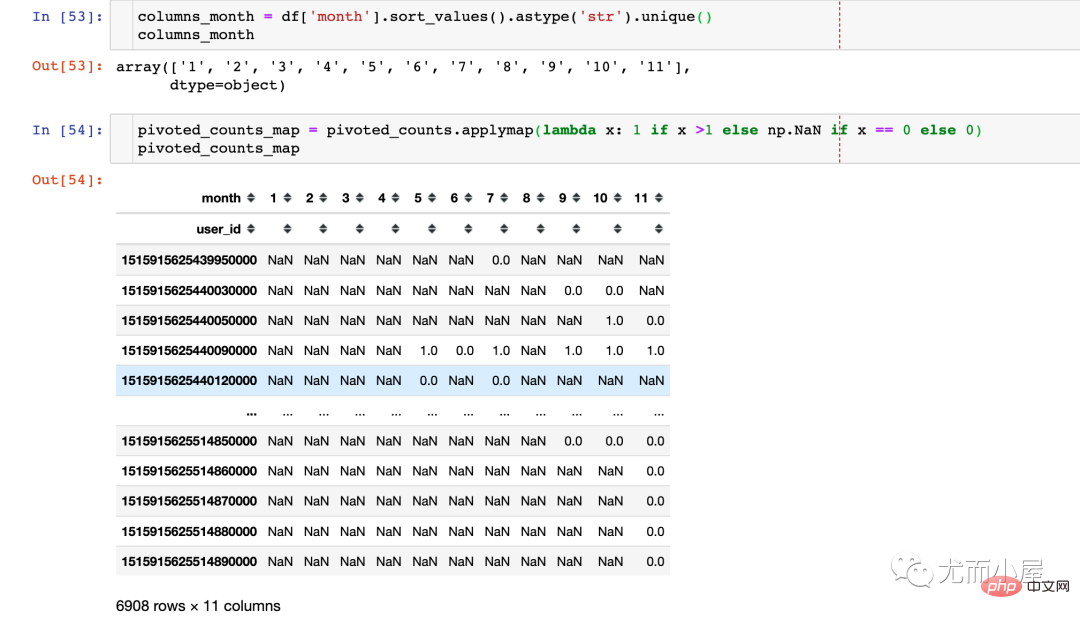
pivoted_counts_map.sum() / pivoted_counts_map.count()

# 结果
month
1 0.406340
2 0.439655
3 0.474640
4 0.700328
5 0.829861
6 0.792990
7 0.891452
8 0.920328
9 0.781153
100.609963
110.419592
dtype: float64
(pivoted_counts_map.sum()/pivoted_counts_map.count()).plot(figsize=(12,6))
plt.xticks(range(11),columns_month)
plt.title('复购率')
plt.show()
|
The above is the detailed content of E-commerce data mining based on machine learning | Data exploration. For more information, please follow other related articles on the PHP Chinese website!
Related articles
See more- Technology trends to watch in 2023
- How Artificial Intelligence is Bringing New Everyday Work to Data Center Teams
- Can artificial intelligence or automation solve the problem of low energy efficiency in buildings?
- OpenAI co-founder interviewed by Huang Renxun: GPT-4's reasoning capabilities have not yet reached expectations
- Microsoft's Bing surpasses Google in search traffic thanks to OpenAI technology


