


Image algorithm helps improve efficiency and transfer product review

1. Product review background introduction
Zhuanzhuan is an e-commerce platform that mainly engages in second-hand commodity transactions. Depending on the transaction entities, C2C, C2B, B2C and other transaction relationships can be formed. For example, it is a C2C model for individual users to publish products for sale in the free market of Zhuanzhuan app. Zhuanzhuan company provides C2B services of mailing and door-to-door recycling of mobile phones and other electronic products. Zhuanzhuan app also provides second-hand B2C products with official inspection and warranty and after-sales service. . This article will focus on the application of image algorithms in the review process of product listings in Zhuanzhuan B2C stores.
Due to the non-standard nature of second-hand goods, there are differences in quality even among different inventory goods under the same sku. In order to improve the user experience and increase the transparency of product information, the platform uses real-shot product images when displaying second-hand products and avoids the use of rendered images of standard products. This involves reviewing the relevant display pictures of each product on the shelves in various aspects such as information accuracy and picture quality.
In the early stage of business development, the relevant display pictures of the products on the shelves are manually reviewed to ensure the quality and accuracy of the pictures. The review content mainly includes the following aspects:
- Display pictures Whether it is consistent with the actual product to avoid the situation of "the goods are not on the board";
- Whether the photos of the display pictures are clear, camera focus errors may occasionally occur during the shooting of product pictures in streamlined operations;
- Electronic products such as mobile phones and tablets need to be guaranteed to be free of dirt and have anti-tampering labels attached to key parts;
- In order to display the product images in the app, the product images must be appropriately cropped so that the products can be displayed in the app. Centered in the picture.
With the development of business, more and more products are put on the shelves every day, and manual review gradually exposes some problems in review efficiency and accuracy:
- The review work is boring , prone to fatigue, and the probability of errors in manual review is high;
- The judgment of picture clarity is subjective, and it is difficult to align the review standards between different reviewers;
- The amount of manual review processing has gradually It lags behind the number of products on shelves, creating a bottleneck for the release of products in stores.
In view of the repetitive work in the review content, we use classification, regression, detection and other technologies related to the image field, and use algorithm model output to assist manual judgment, while improving the accuracy of the review results At the same time, the efficiency of the review process has been greatly improved.
2. Automatic review plan
The content that needs to be reviewed during the shelf review includes the following points:
- Whether the product display picture is consistent with the corresponding SKU information.
- Whether the product photography is clear.
- Whether the product has an anti-tampering label.
- Whether the product is dirty.
- Whether the product is in the center area of the image.
In view of the need for review, we have designed the following solutions:
Project solutions that require review Whether the product display picture and the corresponding SKU are consistent Whether the image matches the product photo Clear return plan Whether the product has an anti-tampering label Detection plan Whether the product is dirty Detection plan Whether the product is in the center area of the image Detection plan
The following figure gives a schematic diagram of the main review items for B2C product shelf review:

Audit sample pictures
2.1. Whether the product display picture and the corresponding SKU information are consistent
All goods sold in the mall need to be reviewed The actual product is photographed and displayed, but during the process of putting the product on the shelves in the mall, due to manual errors and other circumstances, the product display image and the corresponding SKU information may not match. To give a simple example, the SKU information of the product is iphone11-red, but the display picture is iphoneX-green. This problem can correspond to the image classification problem, which is equivalent to determining the product category based on image information. However, simply using the classification algorithm cannot solve our problem well. There are the following problems in using classification directly:
The categories are limited. Regardless of whether the input image is in the category, a category will be output.
Due to the fixed category, newly added sku cannot be processed.
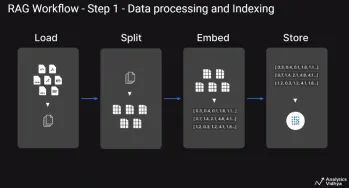
Due to the above problems with the classification method, we changed the strategy and used an image matching scheme. By training a better feature extractor and then using the image matching scheme, we can better solve the problem of adding new categories. The solution we selected is basically consistent with the academic solutions in Face Recognition, Person Re-Identification, Image Retrieval and other directions. The main process includes image feature extraction, image similarity calculation, sorting, and output results. Among them, image feature extraction is the focus of our research. Traditional image matching features include SIFT, SURF, ORB features, etc. Image feature extraction based on deep learning mainly uses CNN neural network for feature extraction. The picture below shows our plan:

Commodity suk review plan
Training phase: The training phase mainly uses cross-entropy loss combined with triplet loss to train a classification network. The backbone network has tried MobileNet, ResNet, ShuffleNet, OSNet, etc. Our experimental results show that the accuracy of the ResNet model is slightly higher, so ResNet is selected as our backbone network.

Triple example
Formula 1 gives the binary cross-entropy loss function, where represents the output value of the sample and represents the label corresponding to the sample. Formula 2 gives the triplet loss function, which represents the feature vector corresponding to the anchor sample, represents the feature vector corresponding to the sample of the same category as the anchor sample, and represents the feature vector corresponding to the sample of a different category than the anchor sample. In the feature space, the distance between the negative sample and the anchor point sample minus the distance between the positive sample and the anchor point should be greater than .
The cross-entropy loss function is a common classification loss function, and the triplet loss function is a commonly used loss function in face recognition and pedestrian re-identification. The triplet loss function can make the features appear in clusters in the feature space. The benefit is that more robust features can be obtained. If the triplet loss function is used alone, the model converges slowly, so we use cross-entropy loss and triplet loss for joint supervised learning to accelerate model convergence and improve model accuracy.
Testing phase: In the testing phase, the trained backbone is selected as the feature extractor to extract embedding features. Extract the query image features and calculate the cosine similarity with the features in the gallery library to obtain a similarity sorted list, and then select the category corresponding to the top1 image in the sorted list as the category output of the query image. But when we were building the gallery, one SKU stored three images, corresponding to different shooting scenes, so we performed knn on the top5 output and obtained the SKU corresponding to the query image.
Online operation: In order to ensure that the SKU output by the matching algorithm must be accurate, we output the top1 similarity in the sorted list. When the similarity is less than a certain value threshold, an alarm message will be output for manual review. This strategy ensures the accuracy of the SKU information output by the algorithm.
2.2. Is the product photographed clear?
During the process of photographing the product, the product moves or the focus is not correct, resulting in the product being photographed blurry. In order to provide users with a better shopping experience, we will return these products during the review process and re-take pictures of the products that meet the requirements before they can be put on the shelves. Simply focusing on whether the image is clear or not can be understood as an image classification problem. Since the labeling of whether an image is blurry is subjective, and the binary classification cannot describe the blurriness of the image well, in the actual review process, front-line reviewers often give different judgment results for slightly blurry images. This Such situations greatly affect the consistency of the review results, resulting in good or bad product display effects in the mall.
In order to solve the above problem, we divide the blurriness of the image into three levels. From high to low, the blurriness is obviously blurred, slightly blurred, and clear. And give the corresponding points, which are 2, 1, and 0 points respectively. Multiple people rate the same image, and remove images that are both clearly blurry and clear at the same time. The remaining images are numerically normalized to obtain the blur score of the image. Of course, we can subdivide the degree of blur into four categories, such as obvious blur, slight blur, subtle blur, and clear, and let more annotators mark the same picture, so that we can get more detailed label values, which can also bring better prediction results. However, in view of limited resources, we only divided the fuzziness into three levels and asked three students to annotate them. From this, we transform the binary classification problem into a regression problem, and can well isolate the business standards. The table below shows how we turn a classification task into a regression task.
Picture name: Classmate 1 points Classmate 2 points Classmate 3 points Total score (0-6) Normalized score Picture 1 is obviously blurred, slightly blurred, obviously blurred 55/6=0.83 Picture 2, slightly blurred, slightly blurred Obvious blur 44/6=0.67 Picture 3 clear Slightly blurry clear 10.17.............
Same, We still use convolutional neural networks, and then change the classification loss function into a regression loss function. We choose MSE as the loss function for the regression task, which represents the predicted value of the sample and represents the label of the sample.
The output value of the model represents the blur degree of the image. After we turn the binary classification task into a regression task, it can bring many benefits. The first is the decoupling of algorithm development and business, so that the algorithm model will not be invalidated due to changes in business standards; at the same time, the business side can set different fuzziness thresholds according to business needs to control the clarity of the mall image.
2.3. Whether the product has an anti-tampering label, whether it is dirty, and whether it is in the central area.
We use a detection solution to address whether the product has an anti-tampering label, whether it is dirty, and whether it is in the central area. . Among these three items, the detection of anti-tamper labels and items is relatively simple. In the detection of anti-tamper labels, the features of anti-tamper labels are single, so it is relatively easy to train a model with a high detection accuracy; if the product is centered during detection, the items are large, and the data is easy to collect, it is also possible to train a product with a high accuracy. Detection model.
The detection of contamination is more difficult because some contamination targets are small and samples are not easy to obtain. To address this problem, we choose an active learning strategy during the data collection process to find more positive samples (the positive samples in the detection task refer to the sample class we need to detect). The method is also very simple. We use a batch of data to train the detection model in the early stage, and then use the model to select suspicious positive samples from a large batch of unlabeled data with very low confidence, and then let the batch of data be manually labeled. Then the training model is updated with new data, which is a cycle. We can repeat this step multiple times and finally get a detection model that is comparable to manual detection.
2.4. Algorithm application strategy
For common classification, detection and other tasks in computer vision, we cannot guarantee that the recall and precision of the model reach 100% indicators at the same time. Therefore, in actual practice During the application process, it is necessary to consider whether the model should be selected in a high-precision or high-recall state based on the actual business. The figure below shows the curve chart of the relationship between recall rate and precision (the picture comes from the book by Teacher Zhou Zhihua)

PR Curve Chart
For our review business, we adopt a high-recall strategy, which means to ensure that the model can find as many product images as possible that do not meet the requirements. The cost is that the accuracy will be reduced accordingly. After we recall products with photographic issues, we will manually intervene and review them, so those examples that are mistakenly recalled will not have an impact on our business.
With the assistance of the algorithm, the workload of students currently reviewing items has been reduced by 50%. Among the product images that have been processed by the algorithm, 50% of the products pass the algorithm and can be directly put on the mall app. The remaining products that are suspected of being problematic will be identified by the algorithm and then reviewed manually.
3. Summary
In the first section, we introduced the background of product review, why we need to review and the content of the review, and also analyzed some problems faced by manual review in the current business. Then the benefits brought by algorithm-empowered business are given.
In Section 2, we introduce the algorithm module in detail. Depending on the items listed for review, we have adopted three methods to solve three different tasks. It also introduces the solution of high recall rate and sacrificing prediction accuracy for the implementation of the algorithm, as well as the feasibility of this solution. Finally, the results achieved by the algorithm are given.
The above is the detailed content of Image algorithm helps improve efficiency and transfer product review. For more information, please follow other related articles on the PHP Chinese website!

 Are You At Risk Of AI Agency Decay? Take The Test To Find OutApr 21, 2025 am 11:31 AM
This article explores the growing concern of "AI agency decay"—the gradual decline in our ability to think and decide independently. This is especially crucial for business leaders navigating the increasingly automated world while retainin
 How to Build an AI Agent from Scratch? - Analytics VidhyaApr 21, 2025 am 11:30 AM
Ever wondered how AI agents like Siri and Alexa work? These intelligent systems are becoming more important in our daily lives. This article introduces the ReAct pattern, a method that enhances AI agents by combining reasoning an
 Revisiting The Humanities In The Age Of AIApr 21, 2025 am 11:28 AM
"I think AI tools are changing the learning opportunities for college students. We believe in developing students in core courses, but more and more people also want to get a perspective of computational and statistical thinking," said University of Chicago President Paul Alivisatos in an interview with Deloitte Nitin Mittal at the Davos Forum in January. He believes that people will have to become creators and co-creators of AI, which means that learning and other aspects need to adapt to some major changes. Digital intelligence and critical thinking Professor Alexa Joubin of George Washington University described artificial intelligence as a “heuristic tool” in the humanities and explores how it changes
 Understanding LangChain Agent FrameworkApr 21, 2025 am 11:25 AM
LangChain is a powerful toolkit for building sophisticated AI applications. Its agent architecture is particularly noteworthy, allowing developers to create intelligent systems capable of independent reasoning, decision-making, and action. This expl
 What are the Radial Basis Functions Neural Networks?Apr 21, 2025 am 11:13 AM
Radial Basis Function Neural Networks (RBFNNs): A Comprehensive Guide Radial Basis Function Neural Networks (RBFNNs) are a powerful type of neural network architecture that leverages radial basis functions for activation. Their unique structure make
 The Meshing Of Minds And Machines Has ArrivedApr 21, 2025 am 11:11 AM
Brain-computer interfaces (BCIs) directly link the brain to external devices, translating brain impulses into actions without physical movement. This technology utilizes implanted sensors to capture brain signals, converting them into digital comman
 Insights on spaCy, Prodigy and Generative AI from Ines MontaniApr 21, 2025 am 11:01 AM
This "Leading with Data" episode features Ines Montani, co-founder and CEO of Explosion AI, and co-developer of spaCy and Prodigy. Ines offers expert insights into the evolution of these tools, Explosion's unique business model, and the tr
 A Guide to Building Agentic RAG Systems with LangGraphApr 21, 2025 am 11:00 AM
This article explores Retrieval Augmented Generation (RAG) systems and how AI agents can enhance their capabilities. Traditional RAG systems, while useful for leveraging custom enterprise data, suffer from limitations such as a lack of real-time dat


Hot AI Tools

Undresser.AI Undress
AI-powered app for creating realistic nude photos

AI Clothes Remover
Online AI tool for removing clothes from photos.

Undress AI Tool
Undress images for free

Clothoff.io
AI clothes remover

Video Face Swap
Swap faces in any video effortlessly with our completely free AI face swap tool!

Hot Article
Hot Tools

MantisBT
Mantis is an easy-to-deploy web-based defect tracking tool designed to aid in product defect tracking. It requires PHP, MySQL and a web server. Check out our demo and hosting services.

Dreamweaver Mac version
Visual web development tools

SublimeText3 Mac version
God-level code editing software (SublimeText3)

PhpStorm Mac version
The latest (2018.2.1) professional PHP integrated development tool

WebStorm Mac version
Useful JavaScript development tools

