Home >Development Tools >phpstorm >Teach you step by step how to debug PHP projects in Docker with phpstorm
Teach you step by step how to debug PHP projects in Docker with phpstorm
- 藏色散人forward
- 2022-01-05 15:43:284980browse
The following tutorial column of phpstorm will introduce to you how to debug PHP projects in Docker with PHPStorm. I hope it will be helpful to friends in need!
This machine has been developed using docker. For those who are used to debugging, placing PHP in a docker container adds another level of difficulty.
Of course, this only applies to when you don’t understand configuration yet. Once you master the trick, it is actually simpler than, and there is almost no difficulty difference from local configuration.
1 Environment
Before we start, let’s make some environmental assumptions:
- Docker is installed on this machine
- There is a PHP container with the xdebug extension installed
- The directory where the code is on this machine is:
/Users/gary/dnmp/www/localhost - Code is mapped to the container directory:
/var/www/html/localhost - The project uses the domain name
localhostand binds it in the host hosts and nginx configuration - PHP-FPM connects to the nginx container/application through the
9000port
The domain name here is not necessarily localhost, if you use Laravel , Yii, Thinkphp and other frameworks, generally use domain names similar to mydev.com, dev.awaimai.com, awaimai.dev, this article is also applicable.
2 php.ini configuration
The main configuration is as follows:
[XDebug]
 xdebug.remote_enable = 1
 xdebug.remote_handler = "dbgp"
 xdebug.remote_host = host.docker.internal
The functions of these lines are:
- Openxdebug remote debugging
- For debugging mode, use
dggp - For remote address, use
host.docker.internal, which is docker The host where the container is located. If the host is a Linux system,host.docker.internalmay not be used. You need to use the IP under the same virtual network of the PHP container and the host. Use thedocker network inspect dnmp_defaultcommand in the host. It can be found, wherednmp_defaultis the network where the container is located.
We have not configured xdebug.remote_port here, because xdebug uses 9000 by default, which is consistent with our FPM, and there is no need to set it again. If FPM uses other ports, remote_port must also be changed to the corresponding port.
After the configuration is completed, restart the PHP container.
2 PHPStorm configuration
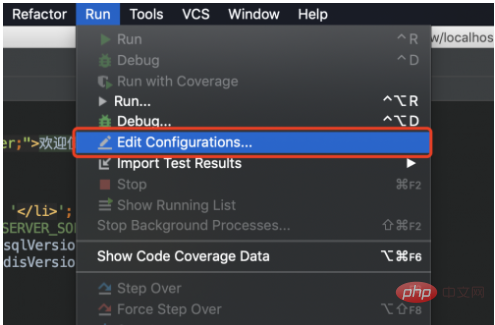
1 Menu selectionRun – Edit Configurations,
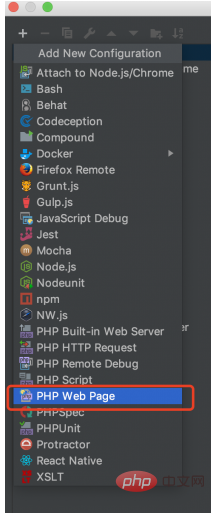
2 Click the number in the upper left corner of the pop-up box and select PHP Web Page.
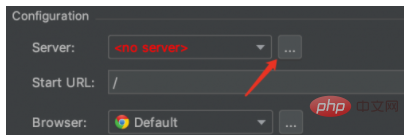
#3 There is no server yet, we need to add one. As shown below, click the ... button on the right side of server.
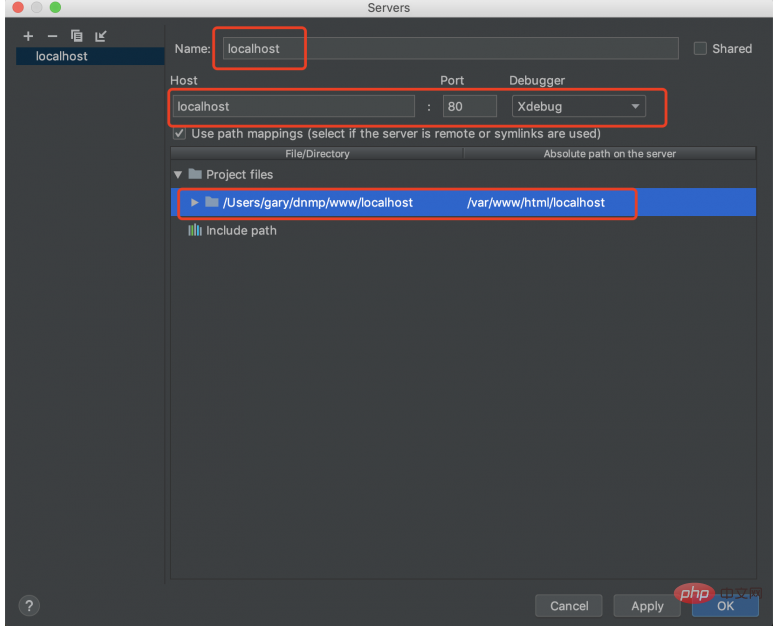
#4 Then there is the configuration server information, here is the docker container.
- Name: Server name, you can write whatever you want.
-
Host: Domain name, here I use
localhost, if your domain name is similar toawaimai.dev, then fill inawaimai. dev. -
Port: The port to connect to the server. Here we connect to PHP through nginx, using the
80port, so the default80is retained here. - Debugger: Use Xdebug.
-
Use path mappings: Heremustcheck
, and then fill in the mapping relationship between local code and container code. If you are using a framework, fill in the root directory of the framework here.
- Name: Fill in a configuration name, fill it in casually, here we debug the homepage, fill in Index
. - Server: Drop down to select the server. Here we select the localhost
we just added. - Start URL: The page to start debugging, /
means the home page, if it is another page, such as/home/index, then Fill in/home/index.
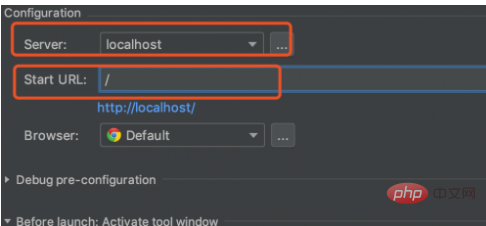
OK to save.
3 Start debugging
Return to the code window, put a [breakpoint] in front of the code, and then click [Debug button] , as follows:
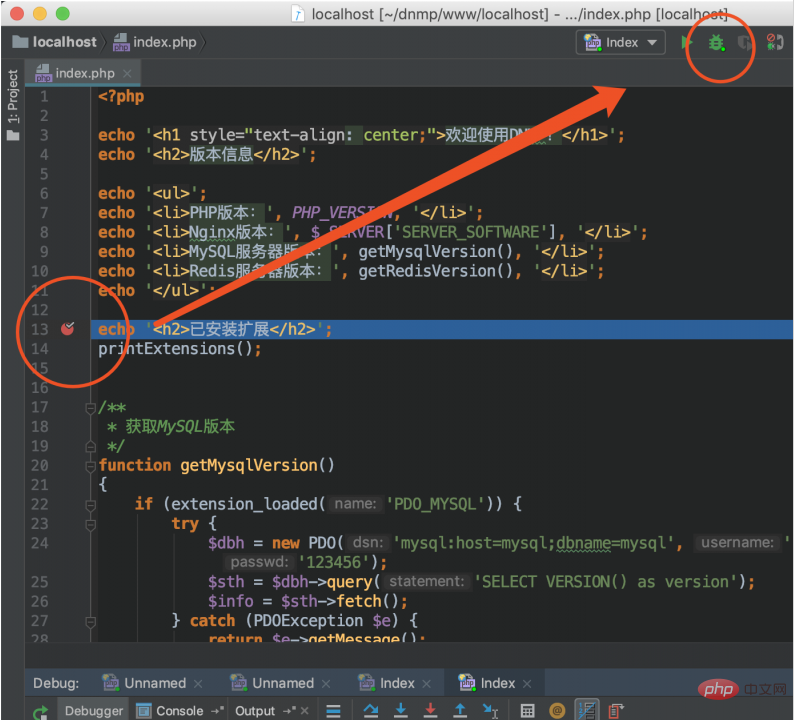
PHPStorm will automatically open the browser and stop automatically when the program reaches the breakpoint.
Here we can see the global variables, call stack, and temporary variables in PHP,
and can single-step debugging, which is very convenient.
The above is the detailed content of Teach you step by step how to debug PHP projects in Docker with phpstorm. For more information, please follow other related articles on the PHP Chinese website!

