Home >Development Tools >phpstorm >Graphical explanation of the configuration method of nginx+phpstorm+xdebug environment
Graphical explanation of the configuration method of nginx+phpstorm+xdebug environment
- 藏色散人forward
- 2021-12-20 14:42:123568browse
I haven’t done PHP development for a long time. Due to the recent maintenance of PHP projects, errors frequently occur when deploying the development environment. If you can debug the code, it will be very convenient to solve the problem. So I configured a development environment that can be debugged based on phpstorm xdebug. During this period, I also consulted and referenced many other people's configuration processes, and found that many of them were not very intuitive or had omissions. Now record my configuration steps here.
1. Install php xdebug nginx
brew install php71
brew install php71-memcached #项目需要,不需要可以不安装
brew install php71-xdebug
brew install nginx
2. Configure nginx
vim ~/homebrew/etc/nginx/servers/drone.conf
# 常规配置,可根据自己项目调整server {
    listen 80;
    # 按自己的需要配置访问的域名
    server_name drone-dev.husor.com;
    root /data/wwwroot/drone/;

    location ~* \.php {
        fastcgi_pass 127.0.0.1:9000;
        include fastcgi_params;
        fastcgi_index   index.php;
        fastcgi_split_path_info ^(.+\.php)(.*)$;
        fastcgi_param   SCRIPT_FILENAME $document_root$fastcgi_script_name;
        fastcgi_param   PATH_INFO   $fastcgi_path_info;
    }
}
3. Configure phpstorm xdebug
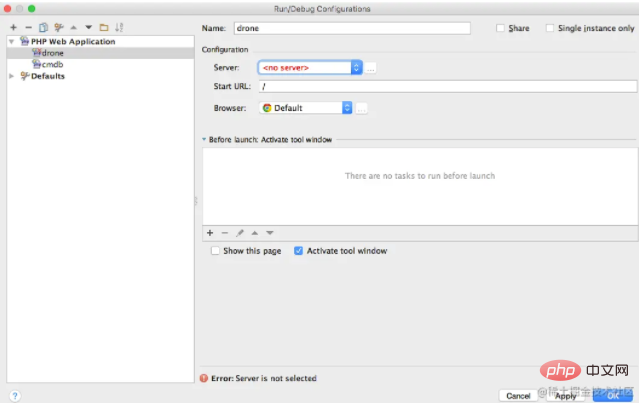
- Select Edit Configrations in the upper right corner of the phpstorm project...

- Create a new PHP Web Application, such as the drone I have here
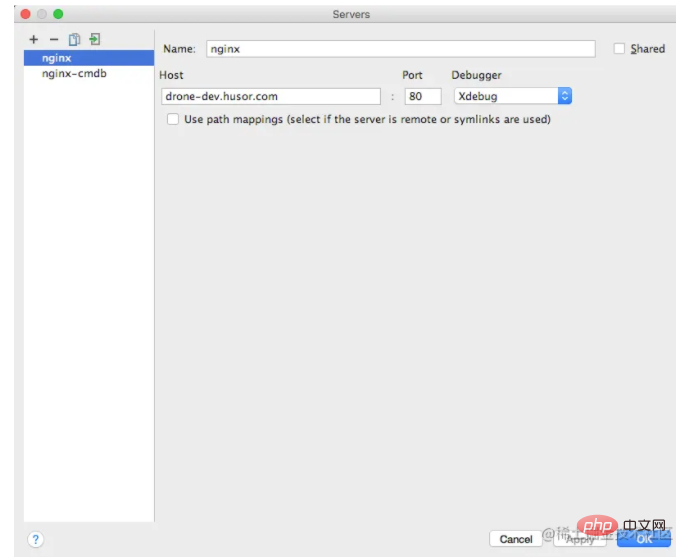
- Click the button after Server to create a new Server, such as the drone I have here nginx
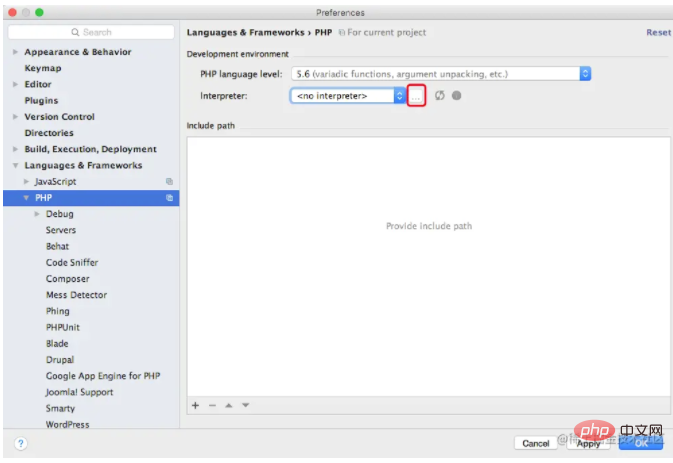
- Open phpstorm’s Preferences, select Languages & Frameworks > PHP, and configure the previously installed php
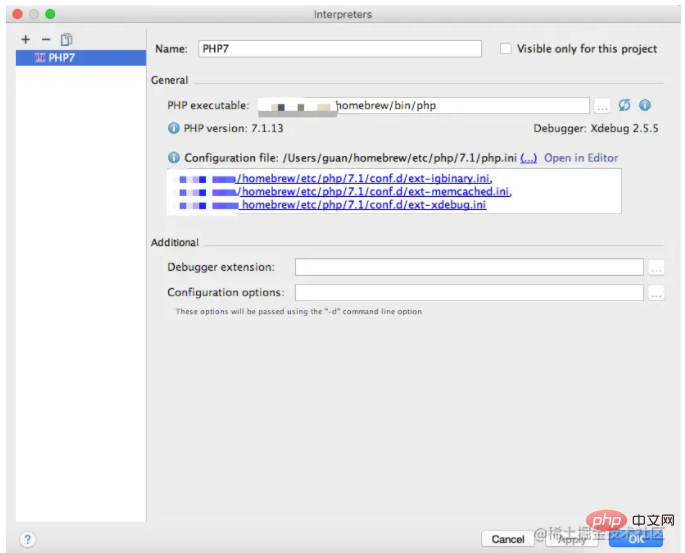
Click the link and open xdebug.ini [Related recommendations: phpstorm usage tutorial]
[xdebug]
; 默认zend_extension路径已经配置好了
zend_extension="/Users/xxx/homebrew/opt/php71-xdebug/xdebug.so" xdebug.idekey="macgdbp"xdebug.remote_enable=1
xdebug.profiler_enable=1
xdebug.remote_host="127.0.0.1"xdebug.remote_port=9001
xdebug.remote_handler="dbgp"
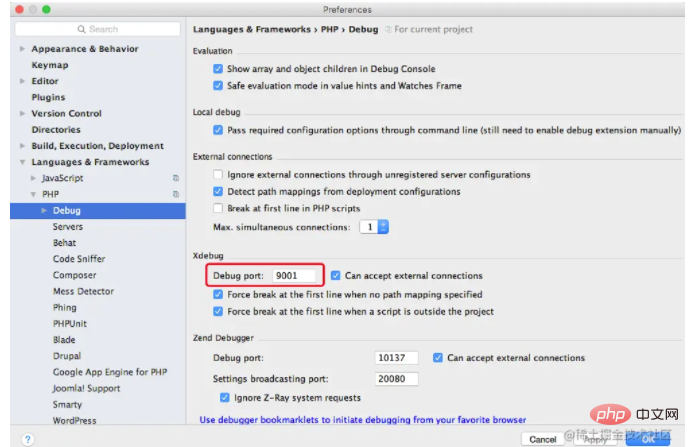
Debug port is consistent with remote_port in xdebug.ini
4. Start php nginx
sudo brew services start nginx
brew services start php71# 如果已经启动过的,就重启复制代码
5. Debugging code
- Click the debug button in the upper right corner of the project

- In Stopped at the breakpoint
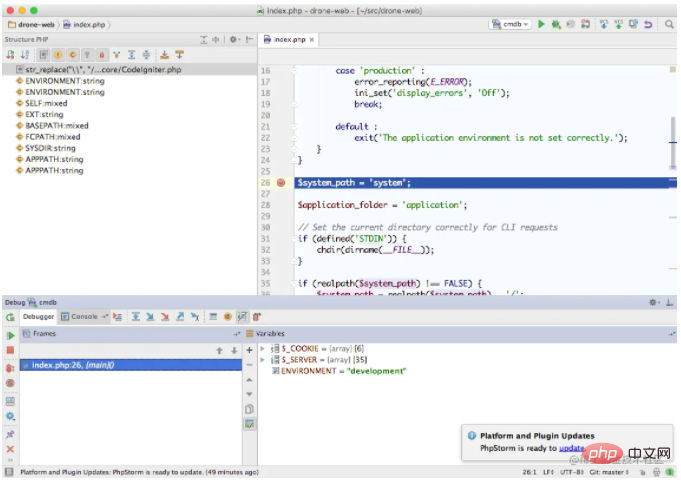
The configuration itself is not difficult. The problem I encountered was that the Debug port was not configured and the remote_port configuration was wrong. Once you understand these two points, you can basically succeed the first time.
The above is the detailed content of Graphical explanation of the configuration method of nginx+phpstorm+xdebug environment. For more information, please follow other related articles on the PHP Chinese website!

