
 Web Front-endJS TutorialA brief analysis of JavaScript debugging methods and techniques_javascript techniques
Javascript, abbreviated as JS, is the front-end development language of web pages and runs directly on the browser. When I first started learning it, I didn’t understand it, so every time I developed or debugged it, I did it in vs.net. , Thinking about it now, it is really painful. In fact, JS is executed in the browser, not on the server, so there is no need to do it in the web development software. You can debug it directly in the browser
Browser Developer Tools
My personal favorite is Chrome Developer Tools. While Safari and Firefox can't meet Chrome's high standards, they are gradually improving. In Firefox, you can use Firebug and Firefox Developer Tools together. If the Firefox team continues to excel in improving built-in developer tools, Firebug may one day become obsolete.
Personal preferences aside, you should be able to experiment and debug arbitrary code in the target browser. Your target browser may or may not include the famous IE8.
Be familiar with the developer tools of your choice. You can also get additional debugging support from an IDE (Integrated Development Environment) or third-party software.
In various debugging tools, the basic knowledge of debugging is the same. In fact, I learned the basics of debugging from Borland's C developer environment in the 90s. Breakpoints and conditions Breakpoints and monitoring are exactly the same as the latest version of Chrome developer tools. Around 2000, I caught my first exception in Java. The concept of stack traces still applies, and even though JavaScript terminology refers to it as an Error, inspecting a stack trace is still as useful as ever.
Some knowledge points are unique to front-end development. For example:
DOM inspection
DOM breakpoint
Debug events
Memory leak analysis
Breakpoint
Use the debugger statement to add breakpoints in the source code. Once the debugger statement is reached, execution is interrupted. The context of the current scope appears in the console, along with all local and global variables. Move the mouse cursor over a variable to view its value.
You can also create conditional breakpoints in your code:
JavaScript
if (condition) {
  debugger;
}
You can also insert breakpoints and conditional breakpoints in the developer tools according to your needs. In Chrome developer tools, click the line number in the Sources view to add a breakpoint. You can also add breakpoint conditions if you right-click on a breakpoint and select "Edit Breakpoint."
Breakpoint for node changes
If your task is to debug garbage code, you may have this question: Why do DOM nodes change during execution. Chrome developer tools provide a convenient breakpoint that can be used to detect node changes in the element tree.
In the Elements view, right-click an element and select "Break on..." from the right-click menu.

Types of DOM breakpoints may include:
Node changes in the sub-tree of the selected node,
The properties of the selected node change,
The node is deleted.
Avoid logging reference types
When recording an object or array, the value of the primitive type may change in the reference object record. When viewing reference types it is important to remember that code execution during recording and viewing may affect the observed results.
For example, execute the following code in Chrome Developer Tools:
JavaScript
var wallets = [{ amount: 0 }];
setInterval( function() {
  console.log( wallets, wallets[0], wallets[0].amount );
  wallets[0].amount += 100;
}, 1000 );
The recorded values of the second and third attributes are correct, but the value of the object reference in the first attribute is unreliable. The value of the amount field is already determined when you first display this property in the developer tools. No matter how many times you close and reopen the same reference, this value will not change.

Record Reference Type
Always remember what you are recording. When logging primitive types, use watch expressions with breakpoints. If it's asynchronous code, avoid documenting reference types.
Table record
In some developer tools, you can use console.table to record an array of objects in the console.
Try executing the following code in your Chrome developer tools:
JavaScript
console.table(
  [
    {
      id: 1,
      name: 'John',
      address: 'Bay street 1'
    },
    {
      id: 2,
      name: 'Jack',
      address: 'Valley road 2.'
    },
    {
      id: 3,
      name: 'Jim',
      address: 'Hill street 3.'
    }
  ] );
输出是非常好看的表格。所有原始类型都立刻显示出来,它们的值反应记录时的状态。也可以记录复杂类型,显示内容为其类型,内容无法显示。因此, console.table 只能用来显示具有原始类型值的对象构成的二维数据结构。
XHR断点
有时你可能会遇到错误的AJAX请求。如果你无法立刻确认提交请求的代码,XHR断点可以帮你节省时间。当提交某一特殊类型的AJAX时,XHR断点将会终止代码的执行,并将提交请求的代码段呈现给用户。
在Chrome开发者工具的Sources标签页中,其中一个断点类型就是XHR断点。点击 + 图标,你可以输入URL片段,当AJAX请求的URL中出现这个URL片段时,JavaScript代码将会中断。
事件监听器断点
Chrome开发者工具可以捕获所有类型的事件,当用户按下一个键、点击一下鼠标时,可以对触发的事件进行调试。
异常时暂停
Chrome开发者工具可以在抛出异常时暂停 执行 JavaScript代码。这可以让你在Error对象被创建时观察应用的状态。
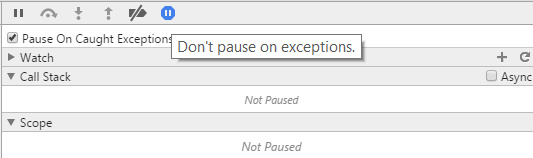
异常时暂停
Sources标签页左侧面板上有一个代码片段(Snippet)子标签页,可用于保存代码片段,帮你调试代码。
如果你坚持使用控制台调试,反复写相同的代码,你应该将你的代码抽象成调试片段。这样的话,甚至还可以把你的调试 技巧教给你 的同事。
Paul Irish发布过一些基本的 调试代码片段 ,例如在函数执行前插入断点。审查这些代码片段,并在网上搜索其他代码片段,这是 很有价值的 。
在函数执行前插入断点
如果你可以得到函数调用的源代码,你还可以在函数调用前插入断点来终止函数的执行。如果你想调试 f 函数,用 debug(f) 语句可以增加这种断点。
Unminify最小化代码
( 译者注:unminify 解压缩并进行反混淆 )
尽可能使用 source map。有时生产代码 不能使用 source map,但不管怎样,你都 不应该直接对生产代码进行调试 。
(译者注:sourcemap 是针对压缩合并后的web代码进行调试的工具)
如果没有source map的话,你最后还可以求助于Chrome开发者工具Sources标签页中的格式化按钮(Pretty Print Button)。格式化按钮 {} 位于源代码文本区域的下方。格式化按钮对源代码进行美化,并改变行号,这使得调试代码更加方便,堆栈跟踪更加有效。
格式化按钮只有在不得已时才会使用。从某种意义上来说, 丑代码就是难看,因为代码中的命名没有明确的语义 。
DOM元素的控制台书签
Chrome开发者工具和Firebug都提供了书签功能,用于显示你在元素标签页(Chrome)或HTML标签页(Firebug)中最后点击的DOM元素。如果你依次选择了 A 元素、 B 元素和 C 元素,
$0 表示 C 元素
$1 表示 B 元素
$2 表示 A 元素
如果你又选择了元素 D ,那么 $0 、 $1 、 $2 和 $3 分别代表 D 、 C 、 B 和 A 。
访问调用栈
JavaScript
var f = function() { g(); }
var g = function() { h(); }
var h = function() { console.trace('trace in h'); }
f();
Chrome开发者工具中的Sources标签页也在Watch表达式下面显示调用栈。
性能审查
性能 审查 工具通常是很有用的。这些工具可以用于防止内存泄露,还可以检测到你的网站哪里需要优化。由于这些工具并不了解你的产品,你可以忽略其某些建议。通常来说,性能分析工具能够有效范围,可以使你的网站显著优化。
审查工具举例:
Chrome开发者工具的Audit标签页
YSlow
熟能生巧
你可能熟悉某些调试技巧,其他 技巧 也会帮你节省不少时间。如果你开始在实践中使用这些技巧,我建议你几周之后重新阅读本文。你将会惊奇地发现,你的关注点在几周内就发生了变化。

 Replace String Characters in JavaScriptMar 11, 2025 am 12:07 AM
Detailed explanation of JavaScript string replacement method and FAQ This article will explore two ways to replace string characters in JavaScript: internal JavaScript code and internal HTML for web pages. Replace string inside JavaScript code The most direct way is to use the replace() method: str = str.replace("find","replace"); This method replaces only the first match. To replace all matches, use a regular expression and add the global flag g: str = str.replace(/fi
 8 Stunning jQuery Page Layout PluginsMar 06, 2025 am 12:48 AM
Leverage jQuery for Effortless Web Page Layouts: 8 Essential Plugins jQuery simplifies web page layout significantly. This article highlights eight powerful jQuery plugins that streamline the process, particularly useful for manual website creation
 Build Your Own AJAX Web ApplicationsMar 09, 2025 am 12:11 AM
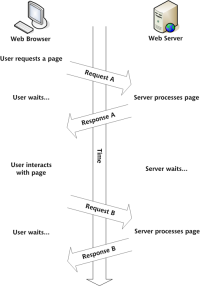
So here you are, ready to learn all about this thing called AJAX. But, what exactly is it? The term AJAX refers to a loose grouping of technologies that are used to create dynamic, interactive web content. The term AJAX, originally coined by Jesse J
 10 jQuery Fun and Games PluginsMar 08, 2025 am 12:42 AM
10 fun jQuery game plugins to make your website more attractive and enhance user stickiness! While Flash is still the best software for developing casual web games, jQuery can also create surprising effects, and while not comparable to pure action Flash games, in some cases you can also have unexpected fun in your browser. jQuery tic toe game The "Hello world" of game programming now has a jQuery version. Source code jQuery Crazy Word Composition Game This is a fill-in-the-blank game, and it can produce some weird results due to not knowing the context of the word. Source code jQuery mine sweeping game
 How do I create and publish my own JavaScript libraries?Mar 18, 2025 pm 03:12 PM
Article discusses creating, publishing, and maintaining JavaScript libraries, focusing on planning, development, testing, documentation, and promotion strategies.
 jQuery Parallax Tutorial - Animated Header BackgroundMar 08, 2025 am 12:39 AM
This tutorial demonstrates how to create a captivating parallax background effect using jQuery. We'll build a header banner with layered images that create a stunning visual depth. The updated plugin works with jQuery 1.6.4 and later. Download the
 Load Box Content Dynamically using AJAXMar 06, 2025 am 01:07 AM
This tutorial demonstrates creating dynamic page boxes loaded via AJAX, enabling instant refresh without full page reloads. It leverages jQuery and JavaScript. Think of it as a custom Facebook-style content box loader. Key Concepts: AJAX and jQuery
 How to Write a Cookie-less Session Library for JavaScriptMar 06, 2025 am 01:18 AM
This JavaScript library leverages the window.name property to manage session data without relying on cookies. It offers a robust solution for storing and retrieving session variables across browsers. The library provides three core methods: Session


Hot AI Tools

Undresser.AI Undress
AI-powered app for creating realistic nude photos

AI Clothes Remover
Online AI tool for removing clothes from photos.

Undress AI Tool
Undress images for free

Clothoff.io
AI clothes remover

AI Hentai Generator
Generate AI Hentai for free.

Hot Article
Hot Tools

mPDF
mPDF is a PHP library that can generate PDF files from UTF-8 encoded HTML. The original author, Ian Back, wrote mPDF to output PDF files "on the fly" from his website and handle different languages. It is slower than original scripts like HTML2FPDF and produces larger files when using Unicode fonts, but supports CSS styles etc. and has a lot of enhancements. Supports almost all languages, including RTL (Arabic and Hebrew) and CJK (Chinese, Japanese and Korean). Supports nested block-level elements (such as P, DIV),

MantisBT
Mantis is an easy-to-deploy web-based defect tracking tool designed to aid in product defect tracking. It requires PHP, MySQL and a web server. Check out our demo and hosting services.

SAP NetWeaver Server Adapter for Eclipse
Integrate Eclipse with SAP NetWeaver application server.

Atom editor mac version download
The most popular open source editor

MinGW - Minimalist GNU for Windows
This project is in the process of being migrated to osdn.net/projects/mingw, you can continue to follow us there. MinGW: A native Windows port of the GNU Compiler Collection (GCC), freely distributable import libraries and header files for building native Windows applications; includes extensions to the MSVC runtime to support C99 functionality. All MinGW software can run on 64-bit Windows platforms.

