


How to use yearfrac function
YEARFRAC function function
Calculate the number of days between the specified start time and the specified end time as a percentage of the number of days in the whole year.
Recommend "excel tutorial"
The syntax structure of YEARFRAC function
YEARFRAC(start_date, end_date, [basis])
Note:
Parameters basis is optional and does not need to appear in the function formula. In addition, the value range of this parameter is set by the Excel program developer. See the figure below for details.

How to use YEARFRAC function
Take the following table as an example for demonstration;

The first step is to call the YEARFRAC function, that is, enter "=YEARFRAC"; during the input process, Excel automatically prompts the function function;

The second step is to set the starting date , pay attention to the date format;

The third step, set the end date, pay attention to the date format;

The fourth step Step 1, set the daily basis type, this parameter is optional;

Step 5, click Enter to view the proportion of days in the time period to the number of days in the whole year.

Notes
If start_date or end_date is not a valid date, the error value #VALUE! will be returned.
The above is the detailed content of How to use the yearfrac function. For more information, please follow other related articles on the PHP Chinese website!

 how to do a drop down in excelMar 12, 2025 am 11:53 AM
This article explains how to create drop-down lists in Excel using data validation, including single and dependent lists. It details the process, offers solutions for common scenarios, and discusses limitations such as data entry restrictions and pe
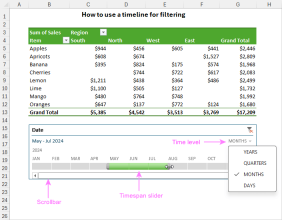 How to create timeline in Excel to filter pivot tables and chartsMar 22, 2025 am 11:20 AM
This article will guide you through the process of creating a timeline for Excel pivot tables and charts and demonstrate how you can use it to interact with your data in a dynamic and engaging way. You've got your data organized in a pivo
 Can excel import xml filesMar 07, 2025 pm 02:43 PM
Excel can import XML data using its built-in "From XML Data Import" function. Import success depends heavily on XML structure; well-structured files import easily, while complex ones may require manual mapping. Best practices include XML
 how to sum a column in excelMar 14, 2025 pm 02:42 PM
The article discusses methods to sum columns in Excel using the SUM function, AutoSum feature, and how to sum specific cells.
 how to make pie chart in excelMar 14, 2025 pm 03:32 PM
The article details steps to create and customize pie charts in Excel, focusing on data preparation, chart insertion, and personalization options for enhanced visual analysis.
 how to calculate mean in excelMar 14, 2025 pm 03:33 PM
Article discusses calculating mean in Excel using AVERAGE function. Main issue is how to efficiently use this function for different data sets.(158 characters)
 how to make a table in excelMar 14, 2025 pm 02:53 PM
Article discusses creating, formatting, and customizing tables in Excel, and using functions like SUM, AVERAGE, and PivotTables for data analysis.
 how to add drop down in excelMar 14, 2025 pm 02:51 PM
Article discusses creating, editing, and removing drop-down lists in Excel using data validation. Main issue: how to manage drop-down lists effectively.


Hot AI Tools

Undresser.AI Undress
AI-powered app for creating realistic nude photos

AI Clothes Remover
Online AI tool for removing clothes from photos.

Undress AI Tool
Undress images for free

Clothoff.io
AI clothes remover

AI Hentai Generator
Generate AI Hentai for free.

Hot Article
Hot Tools

SAP NetWeaver Server Adapter for Eclipse
Integrate Eclipse with SAP NetWeaver application server.

EditPlus Chinese cracked version
Small size, syntax highlighting, does not support code prompt function

Dreamweaver Mac version
Visual web development tools

Notepad++7.3.1
Easy-to-use and free code editor

VSCode Windows 64-bit Download
A free and powerful IDE editor launched by Microsoft

