
Home >Web Front-end >JS Tutorial >Summary of 10 advanced techniques for using Console to debug
Summary of 10 advanced techniques for using Console to debug
- 亚连Original
- 2018-05-29 09:30:031488browse
Usually, when we write a new JavaScript code, errors often occur. It may be a syntax error or a logic error. If there is no debugging tool to help us, I believe your head will explode. The following article mainly summarizes and introduces 10 advanced techniques for using Console to debug. Friends in need can refer to it.
Preface
Over the past ten years, one of my biggest passions has been front-end development (specifically JavaScript). As a "craftsman", I like to specialize in various tools. In this article, I will introduce you to some debugging techniques using the old-fashioned console.
Yes, we all know the basic skills below:
console.log(‘Hello World!');
console.info(‘Something happened…');
console.warn(‘Something strange happened…');
console.error(‘Something horrible happened…');
From now on, I will teach you some skills you don’t know , let you become an experienced driver!
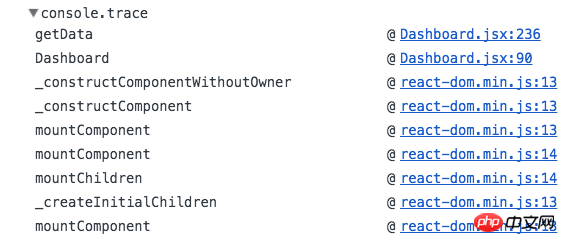
1. console.trace()
#If you want to know where the message is printed, use console .trace()To obtain the stacktrace of the data to be printed.
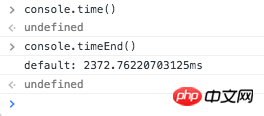
2. console.time() && console.timeEnd()
If If you want to analyze the performance of the function, you can use console.time() to time and console.timeEnd() to end the time. The console will print out the time difference between the two times.
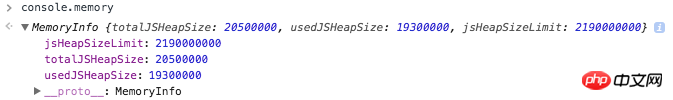
3. console.memory
If you find performance issues difficult to analyze, You may also want to consider whether there is a memory leak. You can use console.memory (note that memory is a property of the console, not a function) to check the current heap usage.
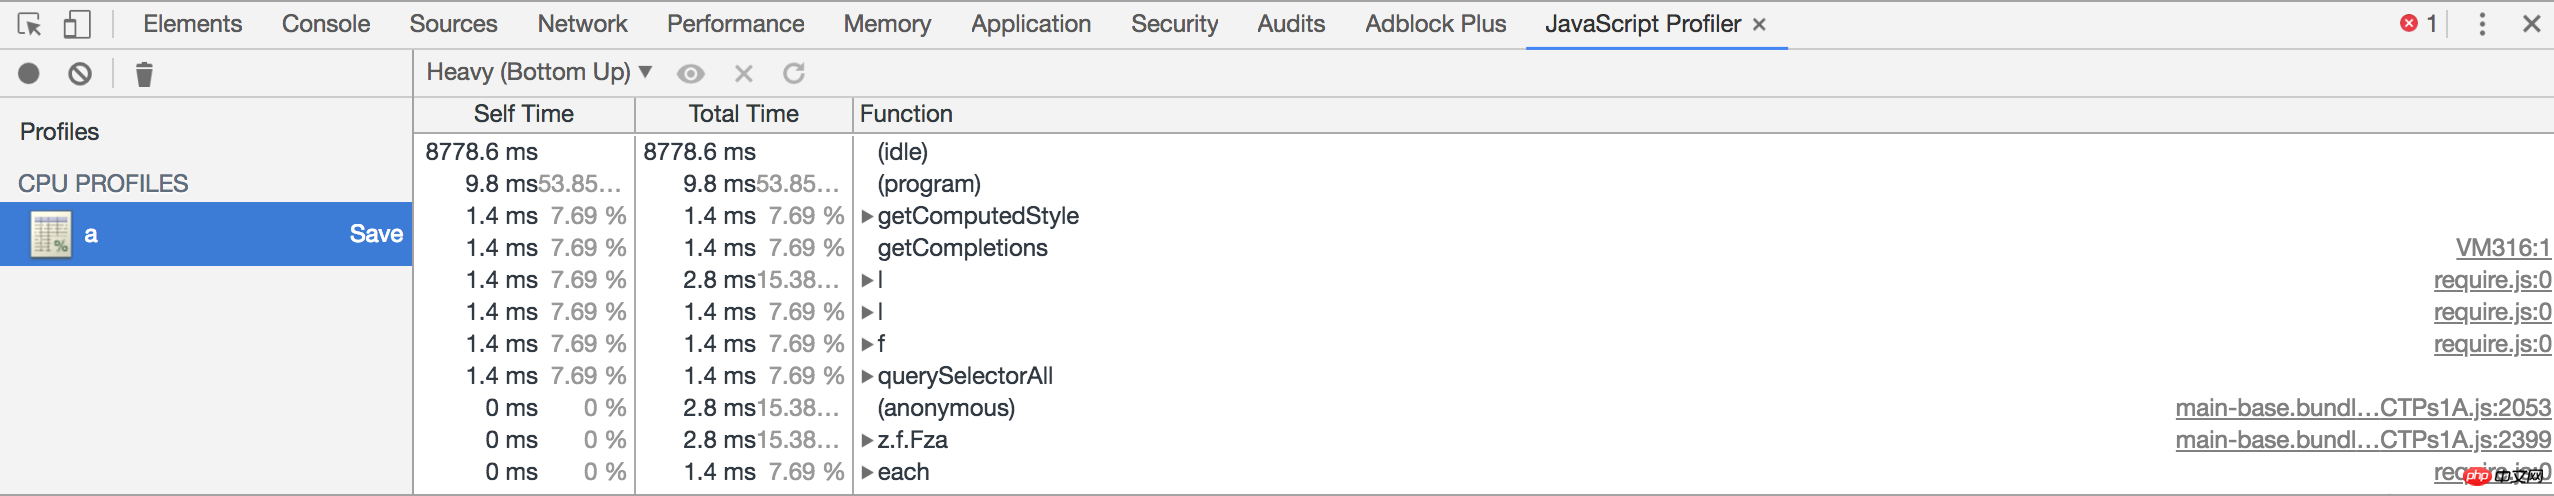
4. console.profile('profileName') & console.profileEnd('profileName')
Although not a standard approach, it is widely accepted and used. You can use these two commands to start and stop profiling. This helps you do accurate profiling in your code. Rather than relying on manual mouse clicks. You can find the profile just now in the browser console JavaScript Profiler.
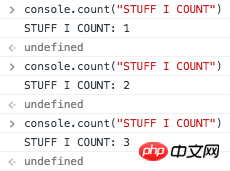
5. console.count(“STUFF I COUNT”)
Sometimes In order to record how many times a function or a piece of code has been executed repeatedly, you can use console.count('?') to record. Every time this code is executed, it will automatically increase by 1.
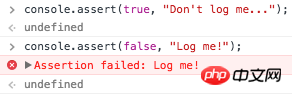
6. console.assert(false, “Log me!”)
Instead of using if-else, you can use console.assert to output messages under certain conditions that are false.
Note: will report an Assertion Error under Node.js.
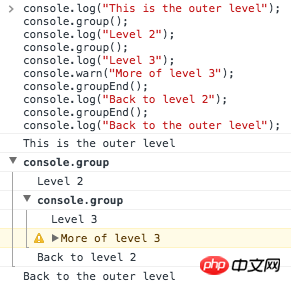
7. console.group('group') & console.groupEnd('group')
If you want to format the printed log, you can use console.group() and console.groupEnd() . Use console.group to aggregate logs into groups and form nested hierarchies.
Please see the example:
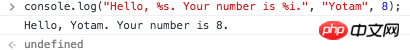
8. String substitutions
You can use console.log to print variables(%s = string, %i = integer, %o = object, %f = float).
9. console.clear()
We have output to the console There are many records, use console.clear() to clear them.
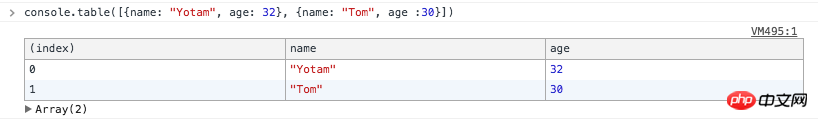
10. console.table()
The last one! You can use console.table() to print the object in table form.
#The above is what I compiled for everyone. I hope it will be helpful to everyone in the future.
Related articles:
detailed explanation of Vue’s global introduction of bass .scss solution
Using node to create your own command line tool tutorial
The above is the detailed content of Summary of 10 advanced techniques for using Console to debug. For more information, please follow other related articles on the PHP Chinese website!
Related articles
See more- An in-depth analysis of the Bootstrap list group component
- Detailed explanation of JavaScript function currying
- Complete example of JS password generation and strength detection (with demo source code download)
- Angularjs integrates WeChat UI (weui)
- How to quickly switch between Traditional Chinese and Simplified Chinese with JavaScript and the trick for websites to support switching between Simplified and Traditional Chinese_javascript skills