






这篇文章主要介绍了使用python导出excel图表以及导出为图片的方法,python相关模块在windows下操作office非常方便,需要的朋友可以参考下
本篇讲下如何使用纯python代码将excel 中的图表导出为图片。这里需要使用的模块有win32com、pythoncom模块。
网上经查询有人已经写好的模块pyxlchart,具体代码如下:
from win32com.client import Dispatch
import os
import pythoncom
class Pyxlchart(object):
 """
 This class exports charts in an Excel Spreadsheet to the FileSystem
 win32com libraries are required.
 """
 def __init__(self):
  pythoncom.CoInitialize()
  self.WorkbookDirectory = ''
  self.WorkbookFilename = ''
  self.GetAllWorkbooks = False
  self.SheetName = ''
  self.ChartName = ''
  self.GetAllWorkbookCharts = False
  self.GetAllWorksheetCharts = False
  self.ExportPath = ''
  self.ImageFilename = ''
  self.ReplaceWhiteSpaceChar = '_'
  self.ImageType = 'jpg'
 def __del__(self):
  pass
 def start_export(self):
  if self.WorkbookDirectory == '':
   return "WorkbookDirectory not set"
  else:
   self._export()
 def _export(self):
  """
  Exports Charts as determined by the settings in class variabels.
  """
  excel = Dispatch("excel.application")
  excel.Visible = False
  wb = excel.Workbooks.Open(os.path.join(self.WorkbookDirectory ,self.WorkbookFilename))
  self._get_Charts_In_Worksheet(wb,self.SheetName,self.ChartName)
  wb.Close(False)
  excel.Quit()
 def _get_Charts_In_Worksheet(self,wb,worksheet = "", chartname = ""):
  if worksheet != "" and chartname != "":
   sht = self._change_sheet(wb,worksheet)
   cht = sht.ChartObjects(chartname)
   self._save_chart(cht)
   return
  if worksheet == "":
   for sht in wb.Worksheets:
    for cht in sht.ChartObjects():
     if chartname == "":
      self._save_chart(cht)
     else:
      if chartname == cht.Name:
       self._save_chart(cht)
  else:
   sht = wb.Worksheets(worksheet)
   for cht in sht.ChartObjects():
    if chartname == "":
     self._save_chart(cht)
    else:
     if chartname == cht.Name:
      self._save_chart(cht)
 def _change_sheet(self,wb,worksheet):
  try:
   return wb.Worksheets(worksheet)
  except:
   raise NameError('Unable to Select Sheet: ' + worksheet + ' in Workbook: ' + wb.Name)
 def _save_chart(self,chartObject):
  imagename = self._get_filename(chartObject.Name)
  savepath = os.path.join(self.ExportPath,imagename)
  print savepath
  chartObject.Chart.Export(savepath,self.ImageType)
 def _get_filename(self,chartname):
  """
  Replaces white space in self.WorkbookFileName with the value given in self.ReplaceWhiteSpaceChar
  If self.ReplaceWhiteSpaceChar is an empty string then self.WorkBookFileName is left as is
  """
  if self.ImageFilename == '':
   self.ImageFilename == chartname
  if self.ReplaceWhiteSpaceChar != '':
   chartname.replace(' ',self.ReplaceWhiteSpaceChar)
  if self.ImageFilename != "":
   return self.ImageFilename + "_" + chartname + "." + self.ImageType
  else:
   return chartname + '.' + self.ImageType
if __name__ == "__main__":
 xl = Pyxlchart()
 xl.WorkbookDirectory = "\\maawtns01\discipline\procurement\MATERIEL\Raw Material\Data Management\Hawk"
 xl.WorkbookFilename = "Hawk Workability KPI.xlsm"
 xl.SheetName = ""
 xl.ImageFilename = "MyChart1"
 xl.ExportPath = "d:\pycharts"
 xl.ChartName = ""
 xl.start_export()
 print "This file does not currently allow direct access"
 print "Please import PyXLChart and run start_export()"

当现有的脚本或服务需要将作用域化的仓库工作委托给 Claude Code 并以编程方式消费结构化响应时,请使用 Claude Agent SDK for Python。
这里还使用Excel vba将chart另存为图片篇中创建的chart_column.xlsx表,使用上面的模块的方法如下:
from pyxlchart import Pyxlchart
xl = Pyxlchart()
xl.WorkbookDirectory = "D:\"
xl.WorkbookFilename = "chart_column.xlsx"
xl.SheetName = ""
#xl.ImageFilename = "MyChart1"
xl.ExportPath = "d:\"
xl.ChartName = ""
xl.start_export()
由于有该表里有多张图表,所以上面未指定xl.ImageFilename ,使用示例如下:
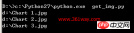
Excel vba将chart另存为图片
python下使用xlswriter模块,可以轻松在excel 中创建图片,不过想实现将生成的chart图表导出为图片,在email 中导入图片的目标 。经网上查询未找到通过python代码将excel 中已经生成的图片导出为图片的方法,不过通过变通方法,使用excel 内的vba 宏却可以轻松将图片导出。
1、导出单张图片
python 创建chart图片代码:
#coding: utf-8
import xlsxwriter
import random
def get_num():
 return random.randrange(0, 201, 2)
workbook = xlsxwriter.Workbook('analyse_spider.xlsx') #创建一个Excel文件
worksheet = workbook.add_worksheet() #创建一个工作表对象
chart = workbook.add_chart({'type': 'column'}) #创建一个图表对象
#定义数据表头列表
title = [u'业务名称',u'星期一',u'星期二',u'星期三',u'星期四',u'星期五',u'星期六',u'星期日',u'平均流量']
buname= [u'运维之路',u'就要IT',u'baidu.com',u'361way.com',u'91it.org'] #定义频道名称
#定义5频道一周7天流量数据列表
data = []
for i in range(5):
 tmp = []
 for j in range(7):
  tmp.append(get_num())
 data.append(tmp)
format=workbook.add_format() #定义format格式对象
format.set_border(1) #定义format对象单元格边框加粗(1像素)的格式
format_title=workbook.add_format() #定义format_title格式对象
format_title.set_border(1) #定义format_title对象单元格边框加粗(1像素)的格式
format_title.set_bg_color('#cccccc') #定义format_title对象单元格背景颜色为
          #'#cccccc'的格式
format_title.set_align('center') #定义format_title对象单元格居中对齐的格式
format_title.set_bold() #定义format_title对象单元格内容加粗的格式
format_ave=workbook.add_format() #定义format_ave格式对象
format_ave.set_border(1) #定义format_ave对象单元格边框加粗(1像素)的格式
format_ave.set_num_format('0.00') #定义format_ave对象单元格数字类别显示格式
#下面分别以行或列写入方式将标题、业务名称、流量数据写入起初单元格,同时引用不同格式对象
worksheet.write_row('A1',title,format_title)
worksheet.write_column('A2', buname,format)
worksheet.write_row('B2', data[0],format)
worksheet.write_row('B3', data[1],format)
worksheet.write_row('B4', data[2],format)
worksheet.write_row('B5', data[3],format)
worksheet.write_row('B6', data[4],format)
#定义图表数据系列函数
def chart_series(cur_row):
 worksheet.write_formula('I'+cur_row,
  '=AVERAGE(B'+cur_row+':H'+cur_row+')',format_ave) #计算(AVERAGE函数)频
               #道周平均流量
 chart.add_series({
  'categories': '=Sheet1!$B$1:$H$1', #将“星期一至星期日”作为图表数据标签(X轴)
  'values':  '=Sheet1!$B$'+cur_row+':$H$'+cur_row, #频道一周所有数据作
                #为数据区域
  'line':  {'color': 'black'}, #线条颜色定义为black(黑色)
  'name': '=Sheet1!$A$'+cur_row, #引用业务名称为图例项
 })
for row in range(2, 7): #数据域以第2~6行进行图表数据系列函数调用
 chart_series(str(row))
chart.set_size({'width': 577, 'height': 287}) #设置图表大小
chart.set_title ({'name': u'爬虫分析'}) #设置图表(上方)大标题
chart.set_y_axis({'name': 'count'}) #设置y轴(左侧)小标题
worksheet.insert_chart('A8', chart) #在A8单元格插入图表
workbook.close() #关闭Excel文档
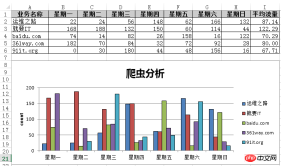
由于这里只有一张图片,通过vba 代码很容易生成图片 。方法为,打开该excel 图表,通过alt + F11 快捷键打开宏编辑界面;打开VB编辑器的立即窗口:”视图“-”立即窗口“,或者使用快捷键"Ctrl + G" ,接着输入如下代码
activesheet.ChartObjects(1).Chart.Export "C:chart.png"
按 " Enter " 键后,会在C盘生成上面的生成的chart图表。
二、导出多张图表
python代码如下:
#coding: utf-8
import xlsxwriter
workbook = xlsxwriter.Workbook('chart_column.xlsx')
worksheet = workbook.add_worksheet()
bold = workbook.add_format({'bold': 1})
# 这是个数据table的列
headings = ['Number', 'Batch 1', 'Batch 2']
data = [
 [2, 3, 4, 5, 6, 7],
 [10, 40, 50, 20, 10, 50],
 [30, 60, 70, 50, 40, 30],
]
worksheet.write_row('A1', headings, bold)
worksheet.write_column('A2', data[0])
worksheet.write_column('B2', data[1])
worksheet.write_column('C2', data[2])
############################################
#创建一个图表,类型是column
chart1 = workbook.add_chart({'type': 'column'})
# 配置series,这个和前面wordsheet是有关系的。
chart1.add_series({
 'name':  '=Sheet1!$B$1',
 'categories': '=Sheet1!$A$2:$A$7',
 'values':  '=Sheet1!$B$2:$B$7',
})
# Configure a second series. Note use of alternative syntax to define ranges.
chart1.add_series({
 'name':  ['Sheet1', 0, 2],
 'categories': ['Sheet1', 1, 0, 6, 0],
 'values':  ['Sheet1', 1, 2, 6, 2],
})
# Add a chart title and some axis labels.
chart1.set_title ({'name': 'Results of sample analysis'})
chart1.set_x_axis({'name': 'Test number'})
chart1.set_y_axis({'name': 'Sample length (mm)'})
# Set an Excel chart style.
chart1.set_style(11)
# Insert the chart into the worksheet (with an offset).
worksheet.insert_chart('D2', chart1, {'x_offset': 25, 'y_offset': 10})
#######################################################################
#
# Create a stacked chart sub-type.
#
chart2 = workbook.add_chart({'type': 'column', 'subtype': 'stacked'})
# Configure the first series.
chart2.add_series({
 'name':  '=Sheet1!$B$1',
 'categories': '=Sheet1!$A$2:$A$7',
 'values':  '=Sheet1!$B$2:$B$7',
})
# Configure second series.
chart2.add_series({
 'name':  '=Sheet1!$C$1',
 'categories': '=Sheet1!$A$2:$A$7',
 'values':  '=Sheet1!$C$2:$C$7',
})
# Add a chart title and some axis labels.
chart2.set_title ({'name': 'Stacked Chart'})
chart2.set_x_axis({'name': 'Test number'})
chart2.set_y_axis({'name': 'Sample length (mm)'})
# Set an Excel chart style.
chart2.set_style(12)
# Insert the chart into the worksheet (with an offset).
worksheet.insert_chart('D18', chart2, {'x_offset': 25, 'y_offset': 10})
#######################################################################
#
# Create a percentage stacked chart sub-type.
#
chart3 = workbook.add_chart({'type': 'column', 'subtype': 'percent_stacked'})
# Configure the first series.
chart3.add_series({
 'name':  '=Sheet1!$B$1',
 'categories': '=Sheet1!$A$2:$A$7',
 'values':  '=Sheet1!$B$2:$B$7',
})
# Configure second series.
chart3.add_series({
 'name':  '=Sheet1!$C$1',
 'categories': '=Sheet1!$A$2:$A$7',
 'values':  '=Sheet1!$C$2:$C$7',
})
# Add a chart title and some axis labels.
chart3.set_title ({'name': 'Percent Stacked Chart'})
chart3.set_x_axis({'name': 'Test number'})
chart3.set_y_axis({'name': 'Sample length (mm)'})
# Set an Excel chart style.
chart3.set_style(13)
# Insert the chart into the worksheet (with an offset).
worksheet.insert_chart('D34', chart3, {'x_offset': 25, 'y_offset': 10})
workbook.close()
同一数据源上面创建了三种类型的图 ,由于有三张图,上面的导出一张图的方法肯定是不行了,这里打开宏,创建如下宏内容:
Sub exportimg()
Dim XlsChart As ChartObject
For Each XlsChart In Worksheets("Sheet1").ChartObjects
 XlsChart.Chart.Export Filename:="C:" & XlsChart.Name & ".jpg", FilterName:="JPG"
Next
End Sub
该示例这里就不再截图,具体可以自行运行。
相关推荐:
使用Python将数组的元素导出到变量中(unpacking)
Python免费学习笔记(深入):立即使用
在学习笔记中,你将探索 Python 的核心概念和高级技巧!