






判断young gc频繁主要看gc日志中young gc的发生频率、单次耗时以及伴随的full gc情况。具体做法是统计单位时间内的young gc次数,若该数值远超正常业务负载下的预期(例如每秒多次),且每次停顿时间较长或导致应用响应延迟,即可判定为频繁。同时需结合堆内存使用率曲线,观察eden区是否在每次young gc后迅速填满,这通常意味着对象分配速率过高或存在大对象直接分配至老年代的情况。

如何从GC日志中提取Young GC的时间间隔与频率
通过解析GC日志中的时间戳和事件类型,可以计算出连续两次Young GC之间的时间差,从而得出平均频率。在Java 8及以前版本中,Young GC日志通常以"[GC (Allocation Failure)"开头;在Java 9+或使用G1GC时,可能显示为"[GC pause (young)"。提取这些行的时间戳并计算差值,若发现间隔极短(如几十毫秒内发生多次),则表明Young GC非常频繁。此外,还需关注日志中是否出现"Allocation Failure"标记,这直接反映了Eden区空间不足触发了回收。
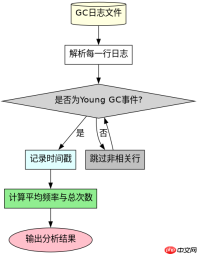
import java.io.BufferedReader;
import java.io.FileReader;
import java.io.IOException;
import java.time.Duration;
import java.time.Instant;
import java.util.ArrayList;
import java.util.List;

public class GcLogAnalyzer {
    public static void main(String[] args) throws IOException {
        // 假设GC日志文件路径
        String logFilePath = "gc.log";
        List<instant> youngGcTimes = new ArrayList();

        try (BufferedReader br = new BufferedReader(new FileReader(logFilePath))) {
            String line;
            while ((line = br.readLine()) != null) {
                // 匹配Java 8风格的Young GC日志
                if (line.contains("[GC (Allocation Failure)")) {
                    // 提取时间戳,格式通常为 [2023-10-01T10:00:00.000+0800]
                    int startIdx = line.indexOf('[');
                    int endIdx = line.indexOf(']');
                    if (startIdx != -1 && endIdx != -1) {
                        String timeStr = line.substring(startIdx + 1, endIdx);
                        try {
                            Instant instant = Instant.parse(timeStr);
                            youngGcTimes.add(instant);
                        } catch (Exception e) {
                            // 忽略无法解析的时间戳
                        }
                    }
                }
                // 匹配Java 9+ G1GC风格的Young GC日志
                else if (line.contains("[GC pause (young)")) {
                    int startIdx = line.indexOf('[');
                    int endIdx = line.indexOf(']');
                    if (startIdx != -1 && endIdx != -1) {
                        String timeStr = line.substring(startIdx + 1, endIdx);
                        try {
                            Instant instant = Instant.parse(timeStr);
                            youngGcTimes.add(instant);
                        } catch (Exception e) {
                            // 忽略无法解析的时间戳
                        }
                    }
                }
            }
        }

        // 计算频率
        if (youngGcTimes.size() > 1) {
            long totalDurationMs = Duration.between(youngGcTimes.get(0), youngGcTimes.get(youngGcTimes.size() - 1)).toMillis();
            double frequencyPerSecond = (youngGcTimes.size() - 1) * 1000.0 / totalDurationMs;
            System.out.println("Young GC总次数: " + youngGcTimes.size());
            System.out.println("总持续时间(毫秒): " + totalDurationMs);
            System.out.printf("平均频率: %.2f 次/秒%n", frequencyPerSecond);
        } else {
            System.out.println("未检测到足够的Young GC事件进行频率分析。");
        }
    }
}
</instant>
运行上述代码并指向一个包含大量Young GC的GC日志文件,预期输出将显示具体的Young GC次数、总持续时间和计算出的平均每秒频率。如果频率超过每秒几次甚至更高,通常被视为频繁。开发者应记录这个基准值,并与业务高峰期的预期吞吐量进行对比,以确定是否需要优化。
Young GC频繁时的堆内存分布特征是什么
当Young GC频繁发生时,堆内存中的Eden区通常处于“快速填满-清空”的循环状态。在GC日志中,可以通过观察每次Young GC前后的Eden区容量变化来确认这一点。正常情况下,Eden区在一次Young GC后会释放大部分空间,但如果对象分配速率极高,Eden区会迅速再次被填满,导致下一次Young GC很快触发。此外,如果频繁Young GC伴随着老年代空间的缓慢增长,可能意味着部分短生命周期对象未能及时回收,或者存在大对象直接晋升到老年代的情况。此时,检查日志中是否有"Promotion Failed"或老年代空间不足的警告至关重要。


import java.io.BufferedReader;
import java.io.FileReader;
import java.io.IOException;
import java.util.HashMap;
import java.util.Map;

public class HeapDistributionAnalyzer {
    public static void main(String[] args) throws IOException {
        String logFilePath = "gc.log";
        Map<string integer> gcEventCounts = new HashMap();
        boolean inYoungGcSection = false;
        long edenBefore = 0;
        long edenAfter = 0;
        long oldGenBefore = 0;
        long oldGenAfter = 0;

        try (BufferedReader br = new BufferedReader(new FileReader(logFilePath))) {
            String line;
            while ((line = br.readLine()) != null) {
                if (line.contains("[GC (Allocation Failure)") || line.contains("[GC pause (young)")) {
                    inYoungGcSection = true;
                    // 重置计数器
                    edenBefore = 0;
                    edenAfter = 0;
                    oldGenBefore = 0;
                    oldGenAfter = 0;
                }

                if (inYoungGcSection) {
                    // 模拟解析堆内存使用情况,实际日志格式可能因JVM版本而异
                    // 这里简化处理,假设日志中包含类似 "Eden: 524288K->0K" 的信息
                    if (line.contains("Eden:")) {
                        // 简单提取箭头前的值作为Before,箭头后的值作为After
                        // 注意:实际解析需要更复杂的正则表达式
                        String[] parts = line.split("->");
                        if (parts.length == 2) {
                            String beforeStr = parts[0].split(":")[1].trim().replace("K", "");
                            String afterStr = parts[1].trim().replace("K", "");
                            try {
                                edenBefore = Long.parseLong(beforeStr);
                                edenAfter = Long.parseLong(afterStr);
                            } catch (NumberFormatException e) {
                                // 忽略解析错误
                            }
                        }
                    }
                    if (line.contains("Old Gen:")) {
                         String[] parts = line.split("->");
                         if (parts.length == 2) {
                             String beforeStr = parts[0].split(":")[1].trim().replace("K", "");
                             String afterStr = parts[1].trim().replace("K", "");
                             try {
                                 oldGenBefore = Long.parseLong(beforeStr);
                                 oldGenAfter = Long.parseLong(afterStr);
                             } catch (NumberFormatException e) {
                                 // 忽略解析错误
                             }
                         }
                    }

                    if (line.contains("total")) { // 假设这是Young GC结束的标志行
                        inYoungGcSection = false;
                        gcEventCounts.put("YoungGC", gcEventCounts.getOrDefault("YoungGC", 0) + 1);
                        System.out.printf("Young GC #%d: Eden %dK->%dK, Old Gen %dK->%dK%n",
                                gcEventCounts.get("YoungGC"), edenBefore, edenAfter, oldGenBefore, oldGenAfter);
                    }
                }
            }
        }
        System.out.println("Total Young GC Events: " + gcEventCounts.getOrDefault("YoungGC", 0));
    }
}
</string>
此代码示例展示了如何从GC日志中提取Eden区和老年代在Young GC前后的内存变化。虽然实际日志解析更为复杂,但该程序的核心逻辑在于追踪Eden区的回收效率。如果观察到Eden区在每次Young GC后几乎完全清空(例如从512MB变为0KB),但随后又迅速达到512MB,这表明对象分配速率极高,是导致Young GC频繁的直接原因。同时,如果老年代在多次Young GC后持续增长,说明有对象提前晋升,这可能加剧内存压力,进而影响GC策略。
Young GC频繁是否会导致Full GC
Young GC频繁本身不直接导致Full GC,但它是Full GC的前兆或诱因之一。当Young GC过于频繁,且老年代空间不足以容纳从年轻代晋升的对象时,可能会触发Full GC。此外,如果Young GC过程中发现老年代空间不足,无法完成对象晋升,也会直接触发Full GC。因此,判断Young GC是否导致Full GC的关键在于观察GC日志中Young GC之后是否紧跟着Full GC事件,以及老年代的使用率是否在Young GC后显著上升。如果老年代使用率接近阈值,即使Young GC频繁,也可能不会立即触发Full GC,直到老年代真正耗尽。
Java免费学习笔记:立即使用
解锁 Java 大师之旅:从入门到精通的终极指南


