


Violin Plots: A Powerful Data Visualization Tool
This article delves into violin plots, a compelling data visualization technique merging box plots and density plots. We'll explore how these plots unveil data patterns, making them invaluable for data scientists and machine learning professionals. This guide offers practical techniques and Python examples to empower informed decisions and effective communication of complex datasets.
Key Learning Outcomes:
- Understand the core components and characteristics of violin plots.
- Differentiate violin plots from box plots and density plots.
- Explore the applications of violin plots in machine learning and data analysis.
- Gain hands-on experience creating and comparing these plots using Python code.
- Recognize the importance of violin plots in exploratory data analysis (EDA) and model assessment.
Table of Contents:
- Introduction
- Understanding Violin Plots
- Applications in Data Analysis and Machine Learning
- Comparing Violin, Box, and Density Plots
- Conclusion
- Frequently Asked Questions
Deciphering Violin Plots:
Violin plots offer a sophisticated way to visualize data by combining box plots and density plots. The foundation lies in kernel density estimation (KDE), a non-parametric method for estimating the probability density function (PDF) of a random variable. KDE smooths data points, providing a continuous representation of the data distribution.
Key KDE concepts include:
- Kernel Function: A function that smooths data points by assigning weights based on distance from a target point. Gaussian kernels are common, but others (linear, Epanechnikov) exist.
- Bandwidth: Controls the smoothness of the KDE. A large bandwidth over-smooths, while a small bandwidth overfits.
- Estimation: KDE involves placing a kernel on each data point and summing them for the overall density estimate. The mathematical representation is shown below:

A violin plot mirrors the KDE on both sides of a central box plot, creating the violin shape. The key components are:
- Central Box Plot: Shows the median and interquartile range (IQR).
- Density Plot: Illustrates data probability density, highlighting high-concentration areas.
- Axes: The x-axis represents categories/groups, and the y-axis shows the data distribution.
Violin plots excel with complex distributions, revealing multi-modality and outliers. However, their complexity might reduce intuitiveness for those unfamiliar with data visualization.
Applications in Data Science and Machine Learning:
Violin plots find use in various scenarios:
- Feature Analysis: Understanding feature distributions, identifying outliers, and comparing distributions across categories.
- Model Evaluation: Comparing predicted and actual values to detect bias and variance.
- Hyperparameter Tuning: Comparing model performance across different hyperparameter settings.
Comparing Visualization Methods:
Let's compare violin, box, and density plots using Seaborn, a popular Python library.
Step 1: Install Libraries
!pip install seaborn matplotlib pandas numpy
print('Importing Libraries...',end='')
import seaborn as sns
import matplotlib.pyplot as plt
import pandas as pd
import numpy as np
print('Done')
Step 2: Generate Synthetic Data
np.random.seed(11)
data = pd.DataFrame({
    'Category': np.random.choice(['A', 'B', 'C'], size=100),
    'Value': np.random.randn(100)
})
Step 3: Data Summary
print(data.head())
print(data.describe(include='all'))
print(data['Category'].value_counts())
print(data.isnull().sum())
Step 4: Generate Plots
fig, axes = plt.subplots(1, 3, figsize=(18, 6))
sns.violinplot(x='Category', y='Value', data=data, ax=axes[0])
axes[0].set_title('Violin Plot')
sns.boxplot(x='Category', y='Value', data=data, ax=axes[1])
axes[1].set_title('Box Plot')
for category in data['Category'].unique():
    sns.kdeplot(data[data['Category'] == category]['Value'], label=category, ax=axes[2])
axes[2].set_title('Density Plot')
axes[2].legend(title='Category')
plt.tight_layout()
plt.show()
Output:

Conclusion:
Effective data visualization is crucial in machine learning. Violin plots offer a powerful combination of detail and summary statistics, enhancing feature engineering and selection. Their versatility allows analysis of various data types, revealing hidden patterns and anomalies for improved decision-making and communication.
Key Takeaways:
- Violin plots combine density plot detail and box plot summary statistics.
- They are versatile, working with various data types.
- They assist in feature analysis, model evaluation, and hyperparameter optimization.
- Libraries like Seaborn simplify their creation in Python.
- They effectively communicate complex data distributions.
Frequently Asked Questions:
Q1: How do violin plots aid in feature analysis? A1: They reveal data distribution shapes, highlighting trends and outliers, facilitating feature selection by comparing distributions.
Q2: Can they handle large datasets? A2: Yes, but adjust KDE bandwidth to maintain clarity.
Q3: How to interpret multiple peaks? A3: Multiple peaks indicate distinct data clusters or modes, suggesting subgroups.
Q4: How to customize appearance in Python? A4: Seaborn and Matplotlib offer parameters for color, width, and KDE bandwidth.
(Note: The image used in this article is not owned by [Your Name/Organization] and is used with the author's permission.)
The above is the detailed content of Violin Plots: A Tool for Visualizing Data Distributions. For more information, please follow other related articles on the PHP Chinese website!

 Convert Text Documents to a TF-IDF Matrix with tfidfvectorizerApr 18, 2025 am 10:26 AM
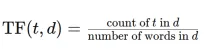
This article explains the Term Frequency-Inverse Document Frequency (TF-IDF) technique, a crucial tool in Natural Language Processing (NLP) for analyzing textual data. TF-IDF surpasses the limitations of basic bag-of-words approaches by weighting te
 Building Smart AI Agents with LangChain: A Practical GuideApr 18, 2025 am 10:18 AM
Unleash the Power of AI Agents with LangChain: A Beginner's Guide Imagine showing your grandmother the wonders of artificial intelligence by letting her chat with ChatGPT – the excitement on her face as the AI effortlessly engages in conversation! Th
 Mistral Large 2: Powerful Enough to Challenge Llama 3.1 405B?Apr 18, 2025 am 10:16 AM
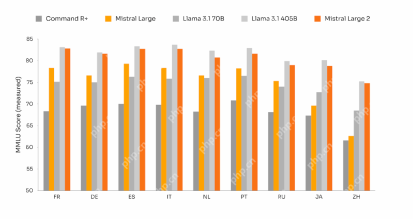
Mistral Large 2: A Deep Dive into Mistral AI's Powerful Open-Source LLM Meta AI's recent release of the Llama 3.1 family of models was quickly followed by Mistral AI's unveiling of its largest model to date: Mistral Large 2. This 123-billion paramet
 What is Noise Schedules in Stable Diffusion? - Analytics VidhyaApr 18, 2025 am 10:15 AM
Understanding Noise Schedules in Diffusion Models: A Comprehensive Guide Have you ever been captivated by the stunning visuals of digital art generated by AI and wondered about the underlying mechanics? A key element is the "noise schedule,&quo
 How to Build a Conversational Chatbot with GPT-4o? - Analytics VidhyaApr 18, 2025 am 10:06 AM
Building a Contextual Chatbot with GPT-4o: A Comprehensive Guide In the rapidly evolving landscape of AI and NLP, chatbots have become indispensable tools for developers and organizations. A key aspect of creating truly engaging and intelligent chat
 Top 7 Frameworks for Building AI Agents in 2025Apr 18, 2025 am 10:00 AM
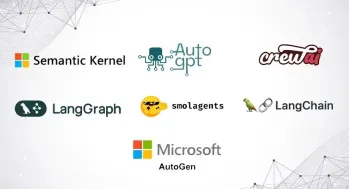
This article explores seven leading frameworks for building AI agents – autonomous software entities that perceive, decide, and act to achieve goals. These agents, surpassing traditional reinforcement learning, leverage advanced planning and reasoni
 What's the Difference Between Type I and Type II Errors ? - Analytics VidhyaApr 18, 2025 am 09:48 AM
Understanding Type I and Type II Errors in Statistical Hypothesis Testing Imagine a clinical trial testing a new blood pressure medication. The trial concludes the drug significantly lowers blood pressure, but in reality, it doesn't. This is a Type
 Automated Text Summarization with Sumy LibraryApr 18, 2025 am 09:37 AM
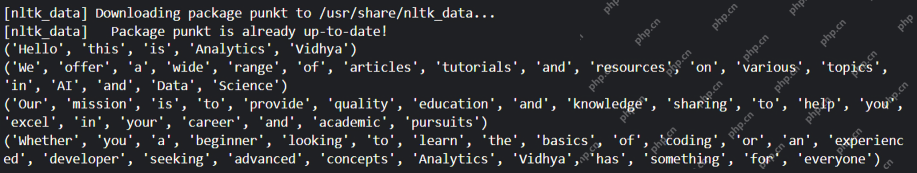
Sumy: Your AI-Powered Summarization Assistant Tired of sifting through endless documents? Sumy, a powerful Python library, offers a streamlined solution for automatic text summarization. This article explores Sumy's capabilities, guiding you throug


Hot AI Tools

Undresser.AI Undress
AI-powered app for creating realistic nude photos

AI Clothes Remover
Online AI tool for removing clothes from photos.

Undress AI Tool
Undress images for free

Clothoff.io
AI clothes remover

AI Hentai Generator
Generate AI Hentai for free.

Hot Article
Hot Tools

MinGW - Minimalist GNU for Windows
This project is in the process of being migrated to osdn.net/projects/mingw, you can continue to follow us there. MinGW: A native Windows port of the GNU Compiler Collection (GCC), freely distributable import libraries and header files for building native Windows applications; includes extensions to the MSVC runtime to support C99 functionality. All MinGW software can run on 64-bit Windows platforms.

SublimeText3 English version
Recommended: Win version, supports code prompts!

SublimeText3 Chinese version
Chinese version, very easy to use

SAP NetWeaver Server Adapter for Eclipse
Integrate Eclipse with SAP NetWeaver application server.

PhpStorm Mac version
The latest (2018.2.1) professional PHP integrated development tool

