


This tutorial shows you how to perform trend analysis in Excel, covering adding trendlines to charts, displaying their equations, and determining their slopes.
When visualizing data, trendlines (also known as lines of best fit) highlight the overall trend. Excel simplifies trendline insertion, particularly in newer versions. However, several techniques can significantly enhance your analysis.
- Adding trendlines in Excel
- Inserting multiple trendlines
- Formatting trendlines
- Extending trendlines for forecasting
- Excel trendline equations
- Calculating trendline slopes
- Removing trendlines
Understanding Excel Trendlines
A trendline is a straight or curved line illustrating the general pattern or direction of data points within a chart. It's primarily used to show data changes over time or correlations between variables. Unlike line charts connecting individual data points, a trendline represents the overall trend, disregarding minor variations and outliers. It can also be used for trend forecasting.
Chart Compatibility
Trendlines are compatible with various Excel chart types, including XY scatter, bubble, stock, and unstacked 2-D bar, column, area, and line graphs. They are not supported by 3-D, stacked, pie, radar, or similar chart types.
Below is a scatter plot with an extended trendline:

Adding Trendlines in Excel
In Excel 2013, 2016, and 2019:
- Select the chart.
- Click the "Chart Elements" button (the plus icon).
- Check the "Trendline" box for a default linear trendline, or click the arrow to choose a different type. Clicking "More Options" opens the "Format Trendline" pane for advanced customization, including equation display.


Alternatively, right-click the data series and select "Add Trendline...".
Excel 2010 Trendlines
In Excel 2010:
- Select the data series.
- Go to "Chart Tools" > "Layout" > "Analysis" > "Trendline". Choose a predefined option or select "More Trendline Options..." for customization.

Multiple Trendlines
Excel supports multiple trendlines per chart.
Trendlines per Data Series
To add a trendline to each data series:
- Right-click a data series and select "Add Trendline...".
- Choose the trendline type.
- Repeat for other series.


Alternatively, use the "Chart Elements" button to select the series and trendline type.

Multiple Trendline Types per Series
To add different trendline types to the same series, add the first trendline, then repeat the process, selecting a different type.

Formatting Trendlines
Customize trendline appearance by right-clicking and selecting "Format Trendline..." or double-clicking the trendline. Adjust color, width, and style in the "Fill & Line" tab.


Extending Trendlines
Project trends by double-clicking the trendline, going to the "Trendline Options" tab, and adjusting the "Forward" and "Backward" forecast periods.

Trendline Equations and R-squared Values
The trendline equation mathematically describes the line's best fit. The R-squared value indicates the goodness of fit (closer to 1 is better). Display both by checking the relevant boxes in the "Trendline Options" tab.

Note: Equations are accurate only for XY scatter plots. Adjust decimal places in the "Label Options" tab for higher precision.

Calculating Trendline Slopes
For linear trendlines, use the SLOPE(known_y's, known_x's) function or the LINEST function (as an array formula) to calculate the slope.

Removing Trendlines
Right-click the trendline and select "Delete," or uncheck the "Trendline" box in "Chart Elements".


This tutorial provides a comprehensive guide to using trendlines in Excel for effective data analysis.
The above is the detailed content of How to add trendline in Excel chart. For more information, please follow other related articles on the PHP Chinese website!

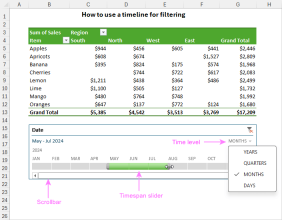 How to create timeline in Excel to filter pivot tables and chartsMar 22, 2025 am 11:20 AM
This article will guide you through the process of creating a timeline for Excel pivot tables and charts and demonstrate how you can use it to interact with your data in a dynamic and engaging way. You've got your data organized in a pivo
 Can excel import xml filesMar 07, 2025 pm 02:43 PM
Excel can import XML data using its built-in "From XML Data Import" function. Import success depends heavily on XML structure; well-structured files import easily, while complex ones may require manual mapping. Best practices include XML
 how to do a drop down in excelMar 12, 2025 am 11:53 AM
This article explains how to create drop-down lists in Excel using data validation, including single and dependent lists. It details the process, offers solutions for common scenarios, and discusses limitations such as data entry restrictions and pe
 how to sum a column in excelMar 14, 2025 pm 02:42 PM
The article discusses methods to sum columns in Excel using the SUM function, AutoSum feature, and how to sum specific cells.
 how to make pie chart in excelMar 14, 2025 pm 03:32 PM
The article details steps to create and customize pie charts in Excel, focusing on data preparation, chart insertion, and personalization options for enhanced visual analysis.
 how to make a table in excelMar 14, 2025 pm 02:53 PM
Article discusses creating, formatting, and customizing tables in Excel, and using functions like SUM, AVERAGE, and PivotTables for data analysis.
 how to calculate mean in excelMar 14, 2025 pm 03:33 PM
Article discusses calculating mean in Excel using AVERAGE function. Main issue is how to efficiently use this function for different data sets.(158 characters)
 how to add drop down in excelMar 14, 2025 pm 02:51 PM
Article discusses creating, editing, and removing drop-down lists in Excel using data validation. Main issue: how to manage drop-down lists effectively.


Hot AI Tools

Undresser.AI Undress
AI-powered app for creating realistic nude photos

AI Clothes Remover
Online AI tool for removing clothes from photos.

Undress AI Tool
Undress images for free

Clothoff.io
AI clothes remover

AI Hentai Generator
Generate AI Hentai for free.

Hot Article
Hot Tools

EditPlus Chinese cracked version
Small size, syntax highlighting, does not support code prompt function

MinGW - Minimalist GNU for Windows
This project is in the process of being migrated to osdn.net/projects/mingw, you can continue to follow us there. MinGW: A native Windows port of the GNU Compiler Collection (GCC), freely distributable import libraries and header files for building native Windows applications; includes extensions to the MSVC runtime to support C99 functionality. All MinGW software can run on 64-bit Windows platforms.

SublimeText3 Chinese version
Chinese version, very easy to use

PhpStorm Mac version
The latest (2018.2.1) professional PHP integrated development tool

SublimeText3 Linux new version
SublimeText3 Linux latest version

