
 Software TutorialOffice Software8 Excel Cell Formatting Tips for Clear and Readable Spreadsheets
Eight tips to improve the readability of Excel tables
This article will share some tips to help you optimize the format of Excel tables to make them easier to read and understand. By cleverly applying formatting techniques such as cell borders, shading, data verification, etc., you can significantly improve the visual effect and data clarity of Excel tables.
1. Adjust column width and row height
To make the table more professional, the column width and row height must be adjusted first to ensure that the text is not overcrowded and there is sufficient spacing between different data segments. All text, numbers and titles should be fully visible, avoiding any part being truncated. This prevents the receiver from overscrolling or scaling.
You can quickly adjust the size of columns and rows to fit the content perfectly using Excel's auto-tuning feature. This feature can be applied to specific columns and rows, or to the entire worksheet. Also, make sure that all sections and each worksheet in the workbook are in the same format.
2. Add cell borders

Without borders, spreadsheets may look like messy numbers or text mixing, difficult to read. Adding borders can separate sections, making it easier for the recipient to distinguish different datasets. Using thin borders within each section prevents data mixing, and I prefer to use light gray borders as internal cell separators.
For key cells or areas, you can use thick or colorful borders to highlight important data points. Proper use of borders can greatly improve the readability of printed forms. However, excessive use of borders should be avoided and styles should be carefully selected to keep the document clear and avoid visual confusion.
3. Merge cells
Merging cells is another feature that helps you organize your spreadsheets. If the table has multiple columns of related data, you can merge the top row cells to create a centered title to mark the entire dataset. Cells can also be merged when creating a cover or summary section of a spreadsheet. If some cells need to accommodate wider inputs, they can be pre-merged.
Merging cells can avoid adjusting cell width or height, especially when containing multiple lines of title or long text. However, merging cells improves readability, but also destroys the sorting function. To prevent the recipient from experiencing data sorting problems, only merge cells for header rows, titles, or partially that do not need to be sorted. Therefore, this feature should be used selectively.
4. Align text

Correctly aligned data makes your spreadsheet easier to understand and makes it look more professional and refined. Regardless of your personal preferences, consistent text alignment throughout the spreadsheet must be maintained.
Title, title and key information should be centered; other texts are aligned left; numerical data are aligned right. However, you can choose different alignments as long as you are consistent with similar types of data. Also, don't forget to align vertically. Always center the data in the cell vertically to avoid awkward spacing.
5. Use cell shading to highlight key parts
Each Excel spreadsheet has summaries, final outputs, or key performance indicators that need prominent, and cell shading is an effective way to achieve this. Different shade colors can be used to intuitively distinguish different parts of a spreadsheet. For large tables, alternating row or column shading can be used.
Complex data can be classified using different colors and highlighted prompts, notes, or warnings in eye-catching colors. However, as with borders, excessive use of shading should be avoided. Use soft colors and maintain a consistent color scheme for similar data types or parts to maintain clarity.
6. Use data verification to control data input

When sharing or collaborating on spreadsheets, data verification can be used to control the data type that can be entered in cells. For columns intended for numerical data, rules that allow only numbers can be set to maintain a consistent data format. For fields with predefined options, you can create a drop-down menu.
You can also set numerical limits to keep the input value within an acceptable range. If someone enters incorrect data, an error message can be configured to prompt the user to correct their entries. In essence, data verification helps keep spreadsheets consistent. Just set these rules carefully to avoid any problems with the recipient.
7. Highlight important data using conditional format
Use conditional formatting to automatically apply formats, such as colors, fonts, or borders, based on cell values. You can use it to highlight data points that exceed a specific threshold or are below the target. It can also help automatically identify outliers or abnormal numbers, making it easier to detect calculation errors.
Icons such as arrows, signs, or traffic lights can also be used to indicate performance status, progress, or risk levels and maintain consistent formats for similar data types. Conditional formatting can also highlight duplicate entries in the list, helping to clean up data. It also helps to compare datasets by highlighting differences or similarities.
8. Use the "Auto-line wrap" function to process long text

Sometimes, when the text exceeds the cell width, it is usually truncated or overflowed to adjacent cells. The line wrap function is a valuable solution to this problem because it breaks down long text into multiple lines within the same cell, making the content easier to read without horizontal scrolling.
Winding lines also helps with better alignment and organization within cells. This feature is usually used for titles and labels to ensure that text remains within cells without affecting adjacent cells. For larger blocks of text spanning multiple rows, it may be necessary to adjust the height and width of the cells for best results.
By applying these tips, you can create clearer, easier to read and understand Excel tables, which will improve productivity and a better user experience.
The above is the detailed content of 8 Excel Cell Formatting Tips for Clear and Readable Spreadsheets. For more information, please follow other related articles on the PHP Chinese website!

 How to Use AI Function in Google SheetsMay 03, 2025 am 06:01 AM
Google Sheets' AI Function: A Powerful New Tool for Data Analysis Google Sheets now boasts a built-in AI function, powered by Gemini, eliminating the need for add-ons to leverage the power of language models directly within your spreadsheets. This f
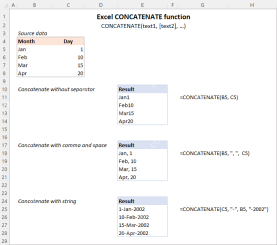 Excel CONCATENATE function to combine strings, cells, columnsApr 30, 2025 am 10:23 AM
This article explores various methods for combining text strings, numbers, and dates in Excel using the CONCATENATE function and the "&" operator. We'll cover formulas for joining individual cells, columns, and ranges, offering solutio
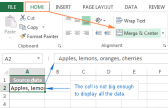 Merge and combine cells in Excel without losing dataApr 30, 2025 am 09:43 AM
This tutorial explores various methods for efficiently merging cells in Excel, focusing on techniques to retain data when combining cells in Excel 365, 2021, 2019, 2016, 2013, 2010, and earlier versions. Often, Excel users need to consolidate two or
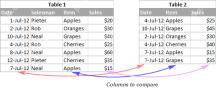 Excel: Compare two columns for matches and differencesApr 30, 2025 am 09:22 AM
This tutorial explores various methods for comparing two or more columns in Excel to identify matches and differences. We'll cover row-by-row comparisons, comparing multiple columns for row matches, finding matches and differences across lists, high
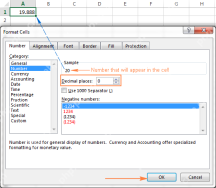 Rounding in Excel: ROUND, ROUNDUP, ROUNDDOWN, FLOOR, CEILING functionsApr 30, 2025 am 09:18 AM
This tutorial explores Excel's rounding functions: ROUND, ROUNDUP, ROUNDDOWN, FLOOR, CEILING, MROUND, and others. It demonstrates how to round decimal numbers to integers or a specific number of decimal places, extract fractional parts, round to the
 Consolidate in Excel: Merge multiple sheets into oneApr 29, 2025 am 10:04 AM
This tutorial explores various methods for combining Excel sheets, catering to different needs: consolidating data, merging sheets via data copying, or merging spreadsheets based on key columns. Many Excel users face the challenge of merging multipl
 Calculate moving average in Excel: formulas and chartsApr 29, 2025 am 09:47 AM
This tutorial shows you how to quickly calculate simple moving averages in Excel, using functions to determine moving averages over the last N days, weeks, months, or years, and how to add a moving average trendline to your charts. Previous articles
 How to calculate average in Excel: formula examplesApr 29, 2025 am 09:38 AM
This tutorial demonstrates various methods for calculating averages in Excel, including formula-based and formula-free approaches, with options for rounding results. Microsoft Excel offers several functions for averaging numerical data, and this gui


Hot AI Tools

Undresser.AI Undress
AI-powered app for creating realistic nude photos

AI Clothes Remover
Online AI tool for removing clothes from photos.

Undress AI Tool
Undress images for free

Clothoff.io
AI clothes remover

Video Face Swap
Swap faces in any video effortlessly with our completely free AI face swap tool!

Hot Article
Hot Tools

SublimeText3 Linux new version
SublimeText3 Linux latest version

SAP NetWeaver Server Adapter for Eclipse
Integrate Eclipse with SAP NetWeaver application server.

SublimeText3 English version
Recommended: Win version, supports code prompts!

PhpStorm Mac version
The latest (2018.2.1) professional PHP integrated development tool

VSCode Windows 64-bit Download
A free and powerful IDE editor launched by Microsoft

