


This tutorial shows you how to quickly calculate simple moving averages in Excel, using functions to determine moving averages over the last N days, weeks, months, or years, and how to add a moving average trendline to your charts.
Previous articles covered calculating standard and weighted averages in Excel. This tutorial explains two methods for calculating moving averages.
What is a Moving Average?

A moving average (also called a rolling average, running average, or moving mean) is a series of averages calculated across subsets of a dataset. It's used in statistics, economic forecasting, and weather prediction to identify underlying trends. In finance, it indicates a security's average value over a specific period. Businesses often use moving averages of sales (e.g., the last three months) to track recent trends.
For example, a three-month moving average of temperatures would average January-March temperatures, then February-April, March-May, and so on. Several types of moving averages exist (simple, exponential, variable, triangular, weighted), but this tutorial focuses on the common simple moving average.
Calculating Simple Moving Averages in Excel
Two methods exist: using formulas and trendlines.
Calculating Moving Averages for a Specific Time Period
The AVERAGE function easily calculates simple moving averages. If column B contains average monthly temperatures, and you need a three-month moving average (as in the image above):
In the cell corresponding to the third month (C4 in the example), enter: =AVERAGE(B2:B4)
Copy this formula down. Use relative row references (without $) for proper adjustment. You can verify the result using the SUM function: =SUM(B2:B4)/3

Calculating Moving Averages for the Last N Days/Weeks/Months/Years
For data like sales or stock quotes, where you want the average of the last three months at any time, you need a formula that recalculates with each new month's entry. Combine AVERAGE with OFFSET and COUNT:
=AVERAGE(OFFSET(*first cell*, COUNT(*entire range*)-*N*,0,*N*,1))
Where N is the number of periods (days, weeks, months, years).
Example: If data is in column B starting at row 2, and you want the last three months' average:
=AVERAGE(OFFSET(B2,COUNT(B2:B100)-3,0,3,1))

Explanation:
-
COUNT(B2:B100)counts entries in column B. -
OFFSETstarts at B2, moves upCOUNT(B2:B100)-3rows, creating a range of 3 rows and 1 column (the last three months). -
AVERAGEcalculates the average of this range.
Tip: Use a large range in COUNT (like B2:B100) to accommodate future data additions.
Calculating Moving Averages for the Last N Values in a Row
To calculate a moving average for the last N values in a row, adjust the OFFSET formula:
=AVERAGE(OFFSET(*first cell*,0,COUNT(*range*)*-N*,1,*N*))
Example: If B2 is the first cell, and you want the average of the last three numbers in the row:
=AVERAGE(OFFSET(B2,0,COUNT(B2:N2)-3,1,3))

Creating a Moving Average Chart in Excel
Adding a moving average trendline to an existing chart is simple using Excel's Trendline feature.
-
Select the chart. In Excel 2013, go to Design > Add Chart Element > Trendline > More Trendline Options…. In Excel 2010/2007, go to Layout > Trendline > More Trendline Options. For a quick result without detailed settings, click Moving Average.
-
The Format Trendline pane (Excel 2013) or dialog box (Excel 2010/2007) appears. Select Moving Average and specify the period (interval).

- The trendline is added to your chart.

Customize the line style using the Fill & Line or Effects tabs. Add multiple trendlines with different periods for a comprehensive analysis.

This tutorial covers calculating moving averages in Excel. A sample workbook is available for download.
The above is the detailed content of Calculate moving average in Excel: formulas and charts. For more information, please follow other related articles on the PHP Chinese website!

 Consolidate in Excel: Merge multiple sheets into oneApr 29, 2025 am 10:04 AM
This tutorial explores various methods for combining Excel sheets, catering to different needs: consolidating data, merging sheets via data copying, or merging spreadsheets based on key columns. Many Excel users face the challenge of merging multipl
 Calculate moving average in Excel: formulas and chartsApr 29, 2025 am 09:47 AM
This tutorial shows you how to quickly calculate simple moving averages in Excel, using functions to determine moving averages over the last N days, weeks, months, or years, and how to add a moving average trendline to your charts. Previous articles
 How to calculate average in Excel: formula examplesApr 29, 2025 am 09:38 AM
This tutorial demonstrates various methods for calculating averages in Excel, including formula-based and formula-free approaches, with options for rounding results. Microsoft Excel offers several functions for averaging numerical data, and this gui
 How to calculate weighted average in Excel (SUM and SUMPRODUCT formulas)Apr 29, 2025 am 09:32 AM
This tutorial shows you two simple ways to calculate weighted averages in Excel: using the SUM or SUMPRODUCT function. Previous articles covered basic Excel averaging functions. But what if some values are more important than others, impacting the f
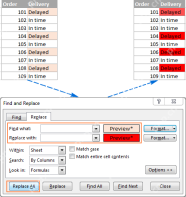 Using Excel Find and Replace in the most efficient wayApr 29, 2025 am 09:07 AM
This tutorial demonstrates how to efficiently locate and modify data within Excel spreadsheets using the Find and Replace function. We'll cover basic and advanced techniques, including wildcard searches and modifications across multiple workbooks. W
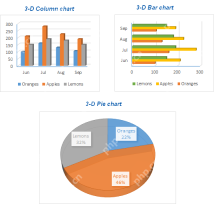 How to make a chart (graph) in Excel and save it as templateApr 28, 2025 am 09:31 AM
This Excel charting tutorial provides a comprehensive guide to creating and customizing graphs within Microsoft Excel. Learn to visualize data effectively, from basic chart creation to advanced techniques. Everyone uses Excel charts to visualize dat
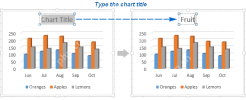 Excel charts: add title, customize chart axis, legend and data labelsApr 28, 2025 am 09:18 AM
After you have created a chart in Excel, what's the first thing you usually want to do with it? Make the graph look exactly the way you've pictured it in your mind! In modern versions of Excel, customizing charts is easy and fun. Microsof
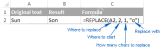 Using Excel REPLACE and SUBSTITUTE functions - formula examplesApr 28, 2025 am 09:16 AM
This tutorial demonstrates the Excel REPLACE and SUBSTITUTE functions with practical examples. Learn how to use REPLACE with text, numbers, and dates, and how to nest multiple REPLACE or SUBSTITUTE functions within a single formula. Last week, we ex


Hot AI Tools

Undresser.AI Undress
AI-powered app for creating realistic nude photos

AI Clothes Remover
Online AI tool for removing clothes from photos.

Undress AI Tool
Undress images for free

Clothoff.io
AI clothes remover

Video Face Swap
Swap faces in any video effortlessly with our completely free AI face swap tool!

Hot Article
Hot Tools

SublimeText3 Mac version
God-level code editing software (SublimeText3)

SAP NetWeaver Server Adapter for Eclipse
Integrate Eclipse with SAP NetWeaver application server.

Atom editor mac version download
The most popular open source editor

SecLists
SecLists is the ultimate security tester's companion. It is a collection of various types of lists that are frequently used during security assessments, all in one place. SecLists helps make security testing more efficient and productive by conveniently providing all the lists a security tester might need. List types include usernames, passwords, URLs, fuzzing payloads, sensitive data patterns, web shells, and more. The tester can simply pull this repository onto a new test machine and he will have access to every type of list he needs.

SublimeText3 Linux new version
SublimeText3 Linux latest version

