


本文实例讲述了Python使用matplotlib实现在坐标系中画一个矩形的方法。分享给大家供大家参考。具体实现方法如下:
import matplotlib.pyplot as plt
from matplotlib.patches import Rectangle
class Annotate(object):
  def __init__(self):
    self.ax = plt.gca()
    self.rect = Rectangle((0,0), 1, 1)
    self.x0 = None
    self.y0 = None
    self.x1 = None
    self.y1 = None
    self.ax.add_patch(self.rect)
    self.ax.figure.canvas.mpl_connect('button_press_event', self.on_press)
    self.ax.figure.canvas.mpl_connect('button_release_event', self.on_release)
  def on_press(self, event):
    print 'press'
    self.x0 = event.xdata
    self.y0 = event.ydata
  def on_release(self, event):
    print 'release'
    self.x1 = event.xdata
    self.y1 = event.ydata
    self.rect.set_width(self.x1 - self.x0)
    self.rect.set_height(self.y1 - self.y0)
    self.rect.set_xy((self.x0, self.y0))
    self.ax.figure.canvas.draw()
a = Annotate()
plt.show()
如下图所示:
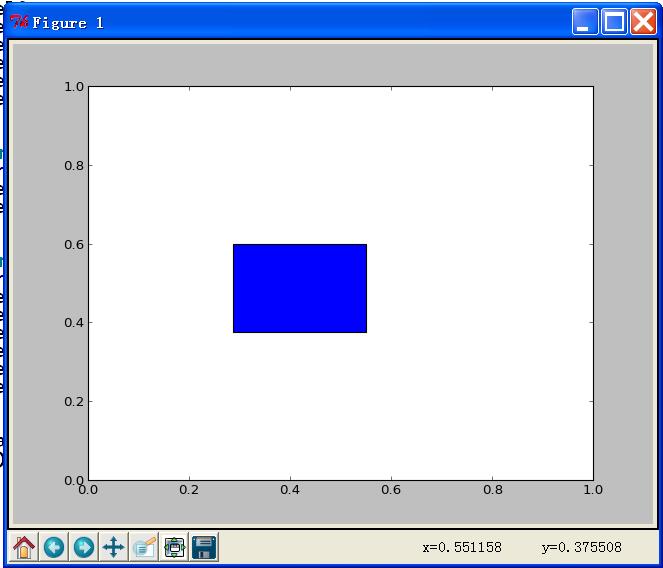
希望本文所述对大家的Python程序设计有所帮助。

 Python: compiler or Interpreter?May 13, 2025 am 12:10 AM
Python is an interpreted language, but it also includes the compilation process. 1) Python code is first compiled into bytecode. 2) Bytecode is interpreted and executed by Python virtual machine. 3) This hybrid mechanism makes Python both flexible and efficient, but not as fast as a fully compiled language.
 Python For Loop vs While Loop: When to Use Which?May 13, 2025 am 12:07 AM
Useaforloopwheniteratingoverasequenceorforaspecificnumberoftimes;useawhileloopwhencontinuinguntilaconditionismet.Forloopsareidealforknownsequences,whilewhileloopssuitsituationswithundeterminediterations.
 Python loops: The most common errorsMay 13, 2025 am 12:07 AM
Pythonloopscanleadtoerrorslikeinfiniteloops,modifyinglistsduringiteration,off-by-oneerrors,zero-indexingissues,andnestedloopinefficiencies.Toavoidthese:1)Use'i
 For loop and while loop in Python: What are the advantages of each?May 13, 2025 am 12:01 AM
Forloopsareadvantageousforknowniterationsandsequences,offeringsimplicityandreadability;whileloopsareidealfordynamicconditionsandunknowniterations,providingcontrolovertermination.1)Forloopsareperfectforiteratingoverlists,tuples,orstrings,directlyacces
 Python: A Deep Dive into Compilation and InterpretationMay 12, 2025 am 12:14 AM
Pythonusesahybridmodelofcompilationandinterpretation:1)ThePythoninterpretercompilessourcecodeintoplatform-independentbytecode.2)ThePythonVirtualMachine(PVM)thenexecutesthisbytecode,balancingeaseofusewithperformance.
 Is Python an interpreted or a compiled language, and why does it matter?May 12, 2025 am 12:09 AM
Pythonisbothinterpretedandcompiled.1)It'scompiledtobytecodeforportabilityacrossplatforms.2)Thebytecodeistheninterpreted,allowingfordynamictypingandrapiddevelopment,thoughitmaybeslowerthanfullycompiledlanguages.
 For Loop vs While Loop in Python: Key Differences ExplainedMay 12, 2025 am 12:08 AM
Forloopsareidealwhenyouknowthenumberofiterationsinadvance,whilewhileloopsarebetterforsituationswhereyouneedtoloopuntilaconditionismet.Forloopsaremoreefficientandreadable,suitableforiteratingoversequences,whereaswhileloopsoffermorecontrolandareusefulf
 For and While loops: a practical guideMay 12, 2025 am 12:07 AM
Forloopsareusedwhenthenumberofiterationsisknowninadvance,whilewhileloopsareusedwhentheiterationsdependonacondition.1)Forloopsareidealforiteratingoversequenceslikelistsorarrays.2)Whileloopsaresuitableforscenarioswheretheloopcontinuesuntilaspecificcond


Hot AI Tools

Undresser.AI Undress
AI-powered app for creating realistic nude photos

AI Clothes Remover
Online AI tool for removing clothes from photos.

Undress AI Tool
Undress images for free

Clothoff.io
AI clothes remover

Video Face Swap
Swap faces in any video effortlessly with our completely free AI face swap tool!

Hot Article
Hot Tools

MinGW - Minimalist GNU for Windows
This project is in the process of being migrated to osdn.net/projects/mingw, you can continue to follow us there. MinGW: A native Windows port of the GNU Compiler Collection (GCC), freely distributable import libraries and header files for building native Windows applications; includes extensions to the MSVC runtime to support C99 functionality. All MinGW software can run on 64-bit Windows platforms.

Dreamweaver Mac version
Visual web development tools

MantisBT
Mantis is an easy-to-deploy web-based defect tracking tool designed to aid in product defect tracking. It requires PHP, MySQL and a web server. Check out our demo and hosting services.

WebStorm Mac version
Useful JavaScript development tools

Zend Studio 13.0.1
Powerful PHP integrated development environment

