利用高斯混合模型對多模態分佈進行分解
- WBOY轉載
- 2023-09-30 11:09:162062瀏覽
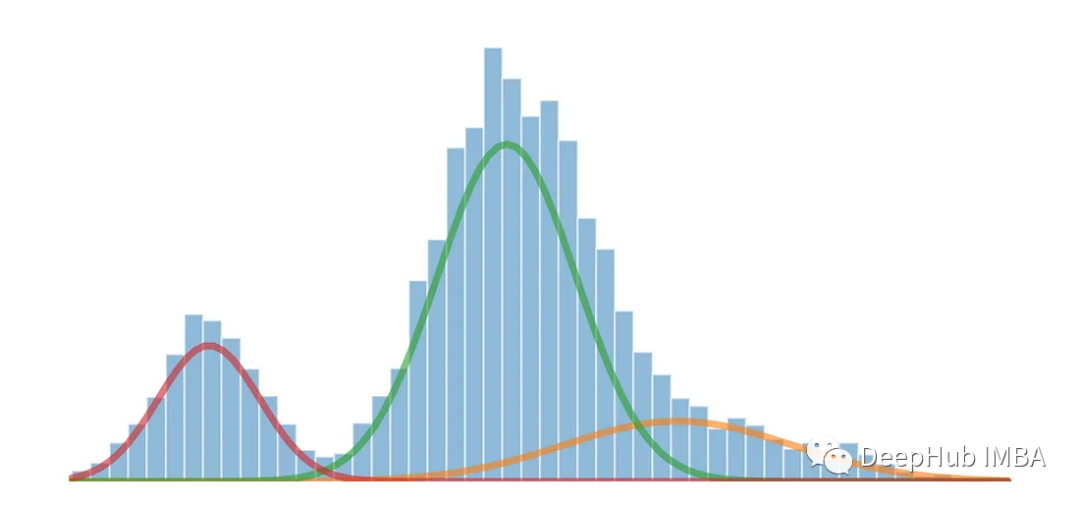
使用高斯混合模型可以將一維多模態分佈拆分為多個分佈

#高斯混合模型(Gaussian Mixture Models,簡稱GMM)是一種在統計和機器學習領域中常用的機率模型,用於對複雜資料分佈進行建模和分析。 GMM 是一種生成模型,它假設觀測資料是由多個高斯分佈組合而成的,每個高斯分佈稱為一個分量,這些分量透過權重來控制其在資料中的貢獻。
產生具有多模態分佈的資料
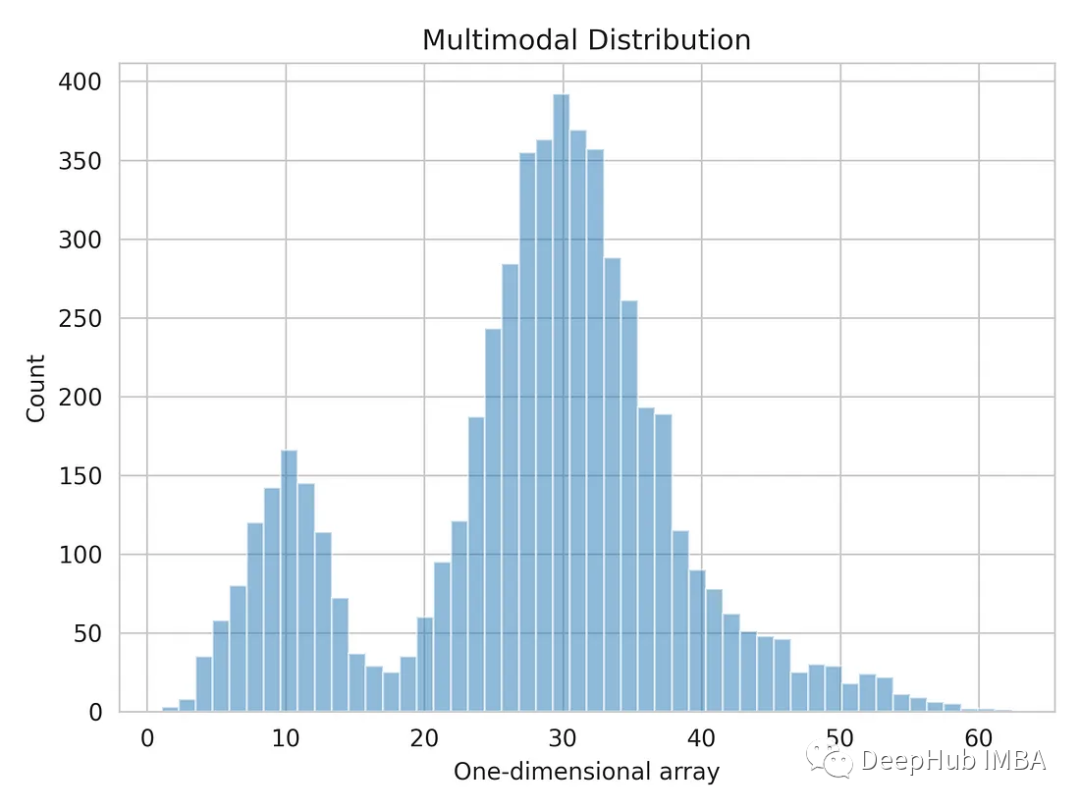
#當一個資料集顯示出多個不同的峰值或模態時,通常意味著資料集中存在多個突出的資料點簇或集中。每個模態代表了分佈中一個突出的資料點簇或集中,可以被視為資料值更可能出現的高密度區域
我們將使用numpy產生的一維數組。
import numpy as np dist_1 = np.random.normal(10, 3, 1000) dist_2 = np.random.normal(30, 5, 4000) dist_3 = np.random.normal(45, 6, 500) multimodal_dist = np.concatenate((dist_1, dist_2, dist_3), axis=0)
讓我們把一維的資料分佈形象化。
import matplotlib.pyplot as plt import seaborn as sns sns.set_style('whitegrid') plt.hist(multimodal_dist, bins=50, alpha=0.5) plt.show()

使用高斯混合模型拆分多模態分佈
我們將使用高斯混合模型來計算每個分佈的平均值和標準差,將多模態分佈分離為三個原始分佈。高斯混合模型是一種無監督機率模型,可用於資料聚類。它使用期望最大化演算法來估計密度區域
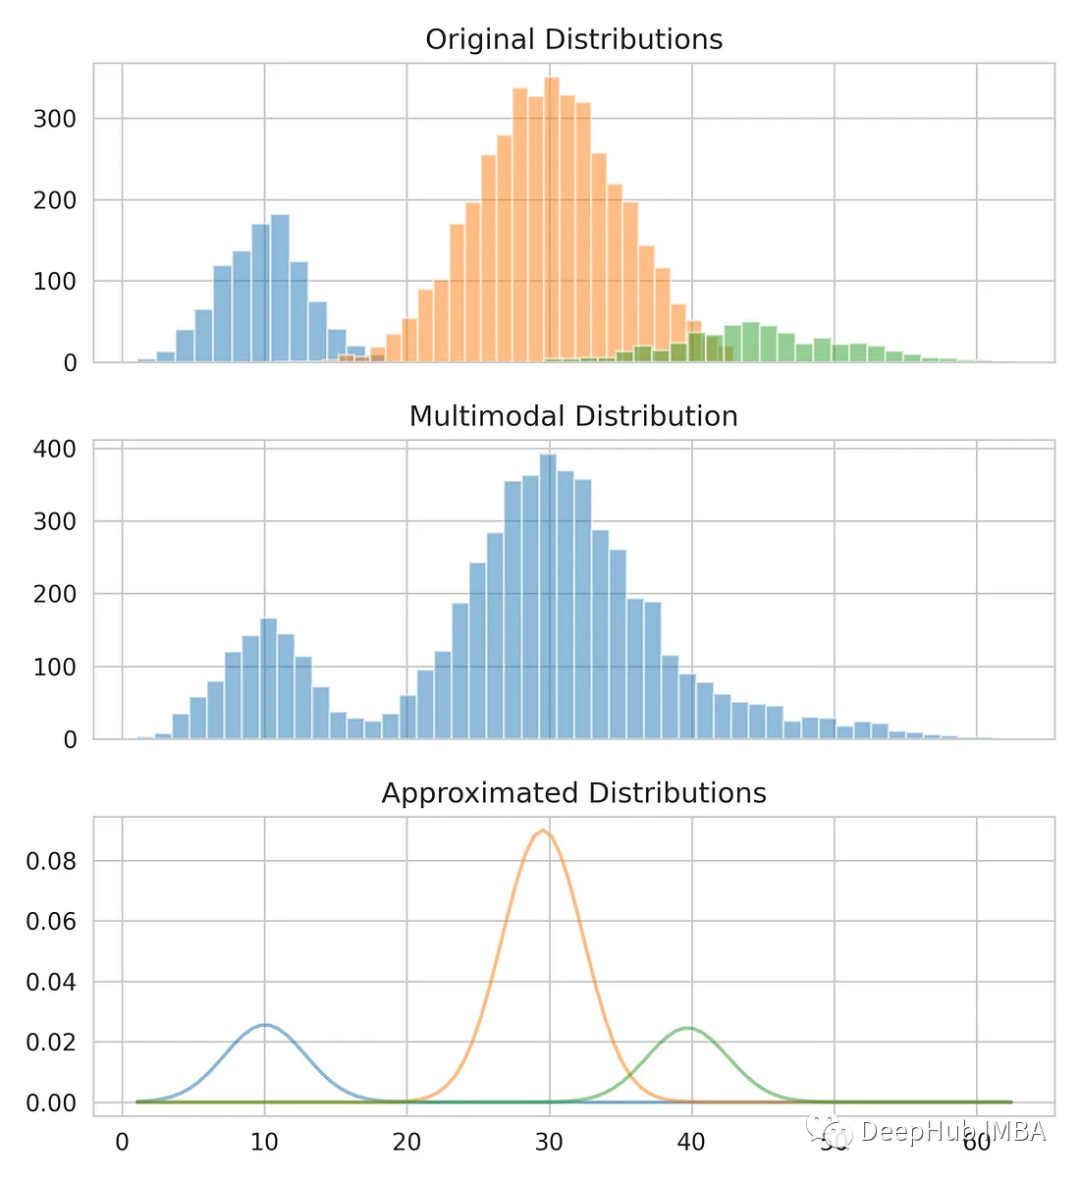
from sklearn.mixture import GaussianMixture gmm = GaussianMixture(n_compnotallow=3) gmm.fit(multimodal_dist.reshape(-1, 1)) means = gmm.means_ # Conver covariance into Standard Deviation standard_deviations = gmm.covariances_**0.5 # Useful when plotting the distributions later weights = gmm.weights_ print(f"Means: {means}, Standard Deviations: {standard_deviations}") #Means: [29.4, 10.0, 38.9], Standard Deviations: [4.6, 3.1, 7.9]
我們已經得到了平均值和標準差,可以對原始分佈進行建模。可以看到雖然平均值和標準差可能不完全正確,但它們提供了一個接近的估計值。
把我們的估計和原始資料比較一下。
from scipy.stats import norm fig, axes = plt.subplots(nrows=3, ncols=1, sharex='col', figsize=(6.4, 7)) for bins, dist in zip([14, 34, 26], [dist_1, dist_2, dist_3]):axes[0].hist(dist, bins=bins, alpha=0.5) axes[1].hist(multimodal_dist, bins=50, alpha=0.5) x = np.linspace(min(multimodal_dist), max(multimodal_dist), 100) for mean, covariance, weight in zip(means, standard_deviations, weights):pdf = weight*norm.pdf(x, mean, std)plt.plot(x.reshape(-1, 1), pdf.reshape(-1, 1), alpha=0.5) plt.show()

#總結
#高斯混合模型是一個功能強大的工具,可以用來對複雜的數據分佈進行建模和分析,同時也是許多機器學習演算法的基礎之一。它的應用範圍廣泛,可以解決各種資料建模和分析問題
這個方法可以用作一種特徵工程技術,來估計輸入變數內子分佈的置信區間
以上是利用高斯混合模型對多模態分佈進行分解的詳細內容。更多資訊請關注PHP中文網其他相關文章!
陳述:
本文轉載於:51cto.com。如有侵權,請聯絡admin@php.cn刪除

