


ogive圖形以圖形化方式表示一組資料的累積分佈函數(CDF),有時也稱為累積頻率曲線。它用於檢查數據分佈並發現模式和趨勢。 Matplotlib、Pandas和Numpy是Python提供的一些函式庫和工具,用於建立ogive圖形。在本教學中,我們將看看如何使用Matplotlib在Python中產生ogive圖形。
要建立一個累積曲線圖,我們需要匯入所需的庫。在這個例子中,我們將使用Matplotlib,Pandas和Numpy。 Matplotlib是一個流行的資料視覺化函式庫,用於在Python中建立互動式圖表和圖形。另一方面,Numpy用於執行複雜的數學運算。 Pandas是另一個廣泛使用的Python函式庫,專門用於資料操作和分析。
文法
plt.plot(*np.histogram(data, bins), 'o-')
在這個語法中,'data'是用來建立累積曲線圖的資料集。資料的頻率分佈由'np.histogram'函數決定,該函數也傳回直方圖的值和箱子邊界。使用'plt.plot'建立累積曲線圖,使用' 'o-' '格式字串來繪製資料點並用線連接它們。然後,'*'運算子將直方圖的值和箱子邊界作為單獨的參數傳遞給'plt.plot'。
範例
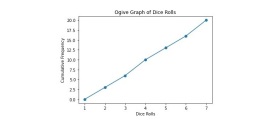
這是一個簡單的範例,創建了一個 ogive 圖來視覺化一個骰子投擲清單的累積頻率分佈。
import numpy as np
import matplotlib.pyplot as plt

# List of dice rolls
rolls = [1, 2, 3, 4, 5, 6, 3, 6, 2, 5, 1, 6, 4, 2, 3, 5, 1, 4, 6, 3]

# Calculate the cumulative frequency
bins = np.arange(0, 8, 1)
freq, bins = np.histogram(rolls, bins=bins)
cumulative_freq = np.cumsum(freq)

# Create the ogive graph
plt.plot(bins[1:], cumulative_freq, '-o')
plt.xlabel('Dice Rolls')
plt.ylabel('Cumulative Frequency')
plt.title('Ogive Graph of Dice Rolls')
plt.show()
首先,我們創建了一個ogive圖來視覺化一組骰子擲出結果的累積頻率分佈,透過導入必要的模組NumPy和Matplotlib來實現。然後,程式碼定義了一組骰子擲出結果,並使用NumPy的直方圖函數來產生資料的“直方圖”,指定資料的分組數和取值範圍。接下來,使用NumPy的'cumsum'函數來表示資料的累積頻率。
最後,使用Matplotlib的「plot」函數將累積頻率繪製為對數圖,其中每個箱的上限用作x軸,形成ogive圖。所得的ogive圖顯示了骰子投擲的累積頻率分佈,其中x軸表示投擲的值,y軸表示這些值在某一點之前的累積頻率。這張圖可以用來分析骰子投擲的頻率和分佈。
輸出
#範例
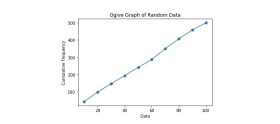
這個範例示範了一個ogive圖,用於視覺化0到100之間的500個隨機數的分佈。
import numpy as np
import matplotlib.pyplot as plt

# Generate random data
data = np.random.randint(0, 100, 500)

# Calculate the cumulative frequency
bins = np.arange(0, 110, 10)
freq, bins = np.histogram(data, bins=bins)
cumulative_freq = np.cumsum(freq)

# Create the ogive graph
plt.plot(bins[1:], cumulative_freq, '-o')
plt.xlabel('Data')
plt.ylabel('Cumulative Frequency')
plt.title('Ogive Graph of Random Data')
plt.show()
在這個範例中,我們首先使用NumPy產生一個包含500個0到100之間的隨機數的資料集。接著使用NumPy計算出資料的累積頻率,每個頻率的區間寬度為10。最後,使用Matplotlib繪製累積頻率與每個區間的上限之間的關係,產生ogive圖。這個範例示範如何使用Python和隨機產生的資料來建立ogive圖。
輸出
#我們學會了使用Matplotlib模組在Python中建立累積曲線圖,這是一個簡單的過程,使用matplotlib函式庫。透過載入資料、計算累積頻率並繪製結果,您可以輕鬆地視覺化資料集的分佈,並識別任何模式或趨勢。您可以使用標籤、標題和樣式自訂您的圖形,使其更具視覺吸引力和資訊量。累積曲線圖是統計分析中有用的工具,可以表示各種數據,從收入分佈到考試成績。
以上是如何在Python中建立累積曲線圖?的詳細內容。更多資訊請關注PHP中文網其他相關文章!

 Python腳本可能無法在UNIX上執行的一些常見原因是什麼?Apr 28, 2025 am 12:18 AM
Python腳本在Unix系統上無法運行的原因包括:1)權限不足,使用chmod xyour_script.py賦予執行權限;2)Shebang行錯誤或缺失,應使用#!/usr/bin/envpython;3)環境變量設置不當,可打印os.environ調試;4)使用錯誤的Python版本,可在Shebang行或命令行指定版本;5)依賴問題,使用虛擬環境隔離依賴;6)語法錯誤,使用python-mpy_compileyour_script.py檢測。
 舉一個場景的示例,其中使用Python數組比使用列表更合適。Apr 28, 2025 am 12:15 AM
使用Python數組比列表更適合處理大量數值數據。 1)數組更節省內存,2)數組對數值運算更快,3)數組強制類型一致性,4)數組與C語言數組兼容,但在靈活性和便捷性上不如列表。
 在Python中使用列表與數組的性能含義是什麼?Apr 28, 2025 am 12:10 AM
列表列表更好的forflexibility andmixDatatatypes,何時出色的Sumerical Computitation sand larged數據集。 1)不可使用的列表xbilese xibility xibility xibility xibility xibility xibility xibility xibility xibility xibility xibles and comply offrequent elementChanges.2)
 Numpy如何處理大型數組的內存管理?Apr 28, 2025 am 12:07 AM
numpymanagesmemoryforlargearraysefefticefticefipedlyuseviews,副本和內存模擬文件.1)viewsAllowSinglicingWithOutCopying,直接modifytheoriginalArray.2)copiesCanbecopy canbecreatedwitheDedwithTheceDwithThecevithThece()methodervingdata.3)metservingdata.3)memore memore-mappingfileShessandAstaStaStstbassbassbassbassbassbassbassbassbassbassbb
 哪個需要導入模塊:列表或數組?Apr 28, 2025 am 12:06 AM
Listsinpythondonotrequireimportingamodule,helilearraysfomthearraymoduledoneedanimport.1)列表列表,列表,多功能和canholdMixedDatatatepes.2)arraysaremoremoremoremoremoremoremoremoremoremoremoremoremoremoremoremoremeremeremeremericdatabuteffeftlessdatabutlessdatabutlessfiblesible suriplyElsilesteletselementEltecteSemeTemeSemeSemeSemeTypysemeTypysemeTysemeTypysemeTypepe。
 可以在Python數組中存儲哪些數據類型?Apr 27, 2025 am 12:11 AM
pythonlistscanStoryDatatepe,ArrayModulearRaysStoreOneType,and numpyArraySareSareAraysareSareAraysareSareComputations.1)列出sareversArversAtileButlessMemory-Felide.2)arraymoduleareareMogeMogeNareSaremogeNormogeNoreSoustAta.3)
 如果您嘗試將錯誤的數據類型的值存儲在Python數組中,該怎麼辦?Apr 27, 2025 am 12:10 AM
WhenyouattempttostoreavalueofthewrongdatatypeinaPythonarray,you'llencounteraTypeError.Thisisduetothearraymodule'sstricttypeenforcement,whichrequiresallelementstobeofthesametypeasspecifiedbythetypecode.Forperformancereasons,arraysaremoreefficientthanl
 Python標準庫的哪一部分是:列表或數組?Apr 27, 2025 am 12:03 AM
pythonlistsarepartofthestAndArdLibrary,herilearRaysarenot.listsarebuilt-In,多功能,和Rused ForStoringCollections,而EasaraySaraySaraySaraysaraySaraySaraysaraySaraysarrayModuleandleandleandlesscommonlyusedDduetolimitedFunctionalityFunctionalityFunctionality。


熱AI工具

Undresser.AI Undress
人工智慧驅動的應用程序,用於創建逼真的裸體照片

AI Clothes Remover
用於從照片中去除衣服的線上人工智慧工具。

Undress AI Tool
免費脫衣圖片

Clothoff.io
AI脫衣器

Video Face Swap
使用我們完全免費的人工智慧換臉工具,輕鬆在任何影片中換臉!

熱門文章
熱工具

PhpStorm Mac 版本
最新(2018.2.1 )專業的PHP整合開發工具

VSCode Windows 64位元 下載
微軟推出的免費、功能強大的一款IDE編輯器

SublimeText3 Mac版
神級程式碼編輯軟體(SublimeText3)

MantisBT
Mantis是一個易於部署的基於Web的缺陷追蹤工具,用於幫助產品缺陷追蹤。它需要PHP、MySQL和一個Web伺服器。請查看我們的演示和託管服務。

Dreamweaver CS6
視覺化網頁開發工具

