微信小程式圖表外掛程式(wx-charts)實例程式碼
- 高洛峰原創
- 2017-02-15 12:42:243579瀏覽
微信小程式圖表工具,charts for WeChat small app
基於canvas繪製,體積小巧
支援圖表類型
餅圖pie
- 柱狀圖column
- 區域圖area
- 程式分析Here
- -idopts.width Number required canvas寬度,單位為px
- opts.height Number required canvas高度,單位為pxopts.title Object (only for ring chart)
. Number 標題字體大小(可選,單位為px)opts.title.color String 標題顏色(可選)
opts.subtitle Object (only for ring chart)
opts.subtitle.name String 副標題內容
opts.subtitle.name String 副標題內容opts.subtitle.fontSize Number 副標題字體大小(可選,單位為px)
opts.subtitle.color String 副標題顏色(可選)
opts.animation Boolean default true 是否動畫展示
opts.animation Boolean default true 是否動畫展示
opts.是否顯示圖表下方各類別的標識
opts.type String required 圖表類型,可選值為pie, line, column, area, ring
opts.categories Array required (餅圖、圓環圖不需要) 資料類別分類
opts.dataLabel Boolean default true 是否在圖表中顯示資料內容值
opts.dataPointShape Boolean default true 是否在圖表中顯示資料點圖形識別
opts.xAGridis Object Xablesable
opts.xA Boolean default false 不繪製X軸網格opts.yAxis Object Y軸配置opts.yAxis.format Function 自訂Y軸文案顯示opts.yAxis.min Number Y軸起始值 .max Number Y軸終止值opts.yAxis.title String Y軸titleopts.yAxis.disabled Boolean default false 不繪製Y軸opts.series Array required 資料列表每個資料列表dataItem Object
dataItem.data Array required (餅圖、圓環圖為Number) 資料
dataItem.color String 例如#7cb5ec 不傳入則使用系統預設配色方案
dataItemname.
dateItem.format Function 自訂顯示資料內容Example
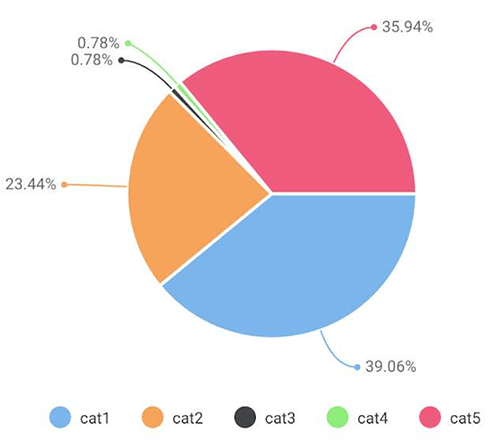
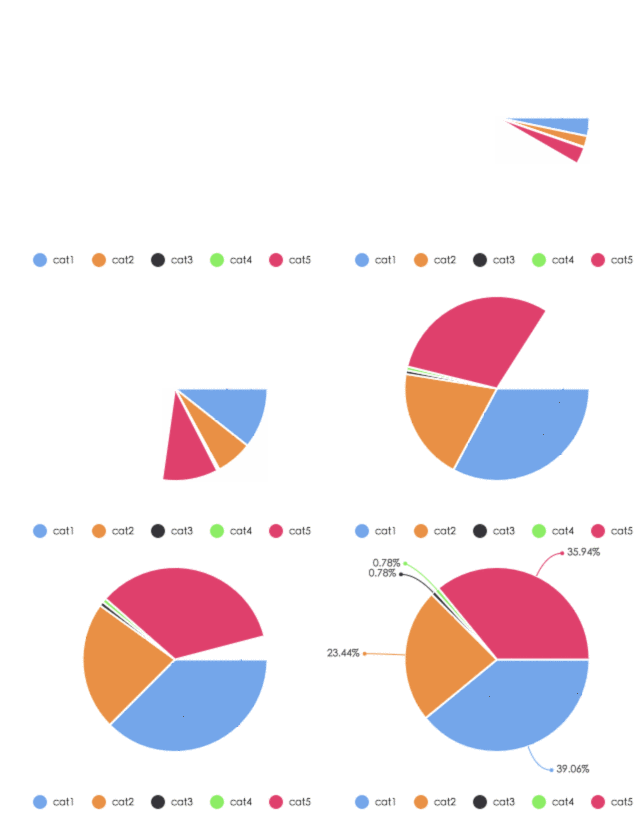
pie chart
var wxCharts = require('wxcharts.js');
new wxCharts({
 canvasId: 'pieCanvas',
 type: 'pie',
 series: [{
  name: 'cat1',
  data: 50,
 }, {
  name: 'cat2',
  data: 30,
 }, {
  name: 'cat3',
  data: 1,
 }, {
  name: 'cat4',
  data: 1,
 }, {
  name: 'cat5',
  data: 46,
 }],
 width: 360,
 height: 300,
 dataLabel: true
});
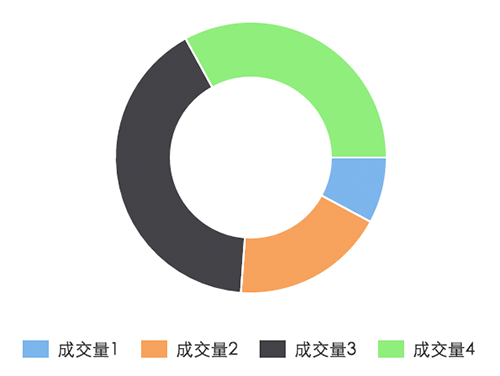
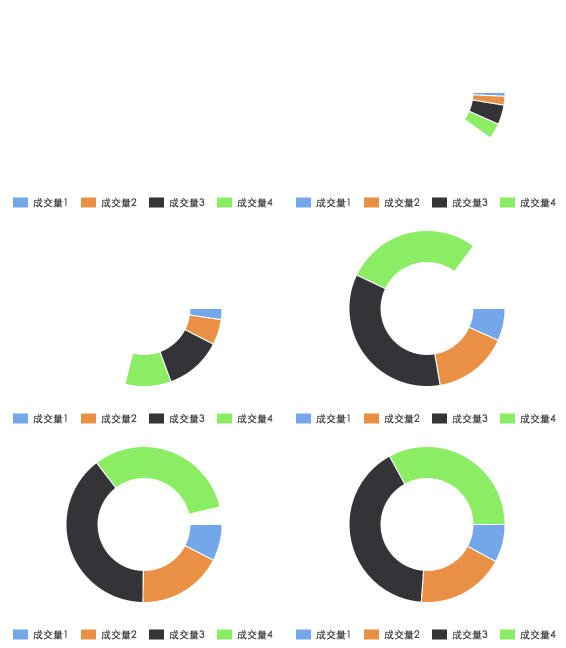
line chart
new wxCharts({
 canvasId: 'ringCanvas',
 type: 'ring',
 series: [{
  name: '成交量1',
  data: 15,
 }, {
  name: '成交量2',
  data: 35,
 }, {
  name: '成交量3',
  data: 78,
 }, {
  name: '成交量4',
  data: 63,
 }],
 width: 320,
 height: 200,
 dataLabel: false
});

areaChart

new wxCharts({
 canvasId: 'lineCanvas',
 type: 'line',
 categories: ['2012', '2013', '2014', '2015', '2016', '2017'],
 series: [{
  name: '成交量1',
  data: [0.15, 0.2, 0.45, 0.37, 0.4, 0.8],
  format: function (val) {
   return val.toFixed(2) + '万';
  }
 }, {
  name: '成交量2',
  data: [0.30, 0.37, 0.65, 0.78, 0.69, 0.94],
  format: function (val) {
   return val.toFixed(2) + '万';
  }
 }],
 yAxis: {
  title: '成交金额 (万元)',
  format: function (val) {
   return val.toFixed(2);
  },
  min: 0
 },
 width: 320,
 height: 200
});

demo下載地址:demo
以上就是本文的全部內容,希望對大家的學習有所幫助,也希望大家多多支持PHP中文網。
更多微信小程式圖表插件(wx-charts)實例代碼相關文章請關注PHP中文網!

