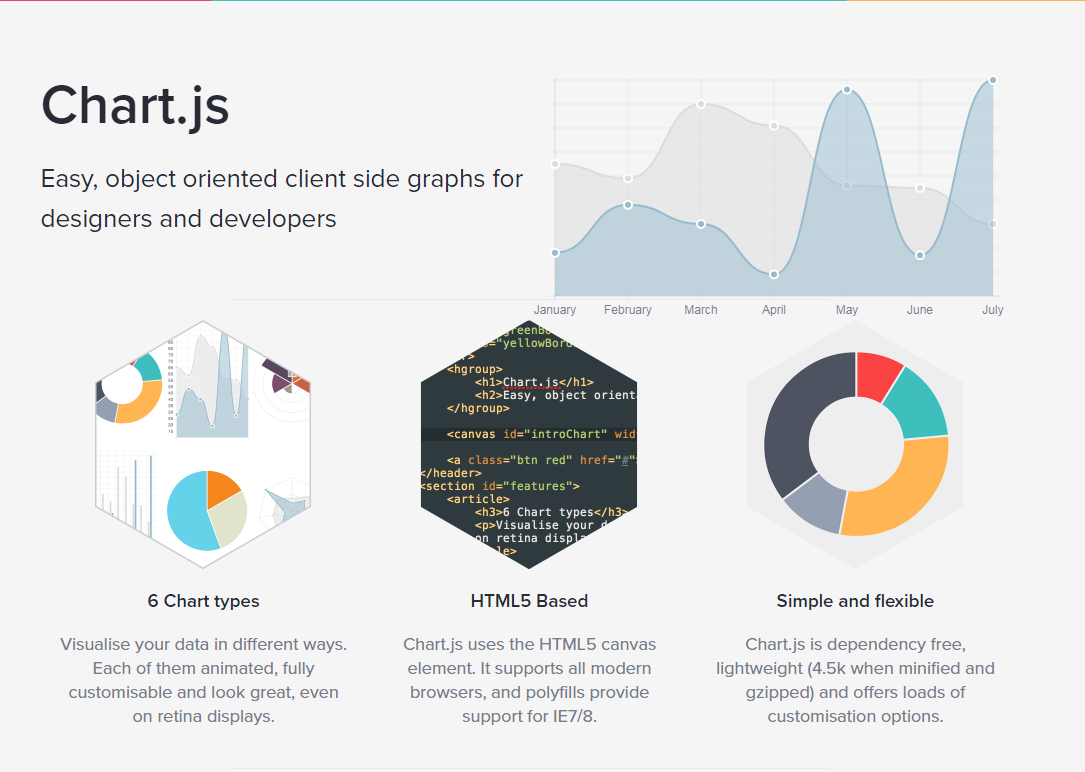
Chart drawing tool library CHART
All resources on this site are contributed by netizens or reprinted by major download sites. Please check the integrity of the software yourself! All resources on this site are for learning reference only. Please do not use them for commercial purposes. Otherwise, you will be responsible for all consequences! If there is any infringement, please contact us to delete it. Contact information: admin@php.cn
Related Article
 Chart drawing beyond border: What is the reason? How to solve it?
05Apr2025
Common reasons and solutions for chart drawing beyond borders and how to solve the problem of chart drawing. When using the chart library for data visualization, you often encounter the chart content exceeding the preset container edge...
 May I ask which tool the real-time monitoring chart in the picture is from_html/css_WEB-ITnose
24Jun2016
May I ask which tool the real-time monitoring chart in the picture is from?
 How Can I Prevent a Button from Submitting an HTML Form?
21Dec2024
Preventing Form Submission on Remove Button ClickIn the provided HTML form, the "remove" button triggers form submission when clicked. To prevent...
 Why Does My AngularJS Button in a Form Cause a Page Refresh?
18Nov2024
AngularJS Button Within Form Triggers Page RefreshThis issue arises when you have a form with both a submit button and a navigation button. Upon...
 How to Create a Button Outside a Form That Doesn\'t Submit It?
26Oct2024
HTML Button to Resist Form SubmissionQuestion:How can one create a button outside an HTML form that does not submit the form when clicked?Consider...
 How Can a Button Prevent Unwanted Form Submission Without JavaScript?
01Dec2024
Can a Button Avoid Submitting a Form?In a form containing two buttons, a "Cancel Changes" button and a "Submit" button, both styled using jQuery...
 How to Determine Which Form Button Was Clicked in PHP?
14Nov2024
Determining Form Button Click in PHPIdentifying which button initiated a form submission can be crucial in PHP development. When multiple buttons...
 How to Prevent a Button Outside a Form from Submitting It?
26Oct2024
Preventing Form Submission from a Button Outside the FormOutside a form, it's possible to create a button with standard HTML, like...


Hot Tools

Frosted glass effect form login interface
A very atmospheric frosted glass effect form login interface
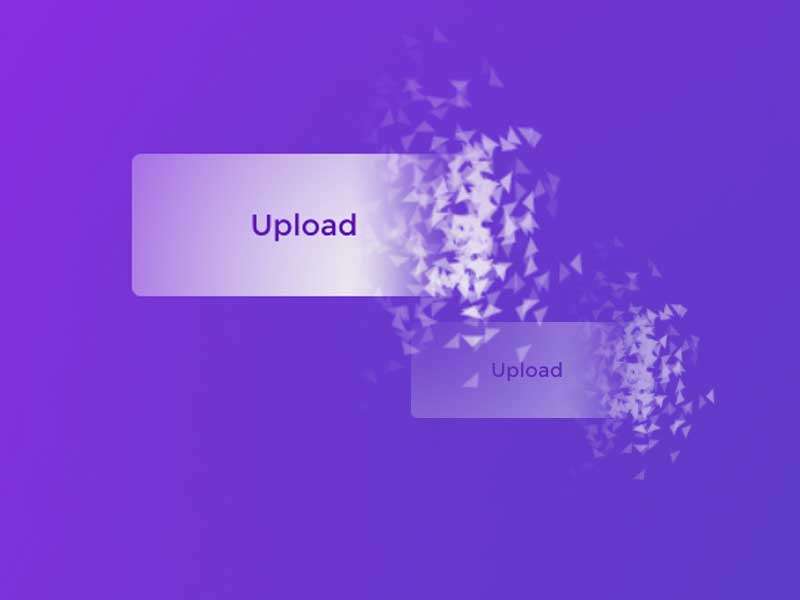
HTML5 cool button particle animation effects
A cool HTML5 button animation that can be used to create burst particle animations
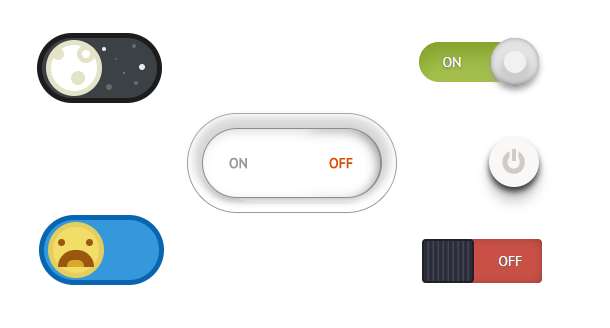
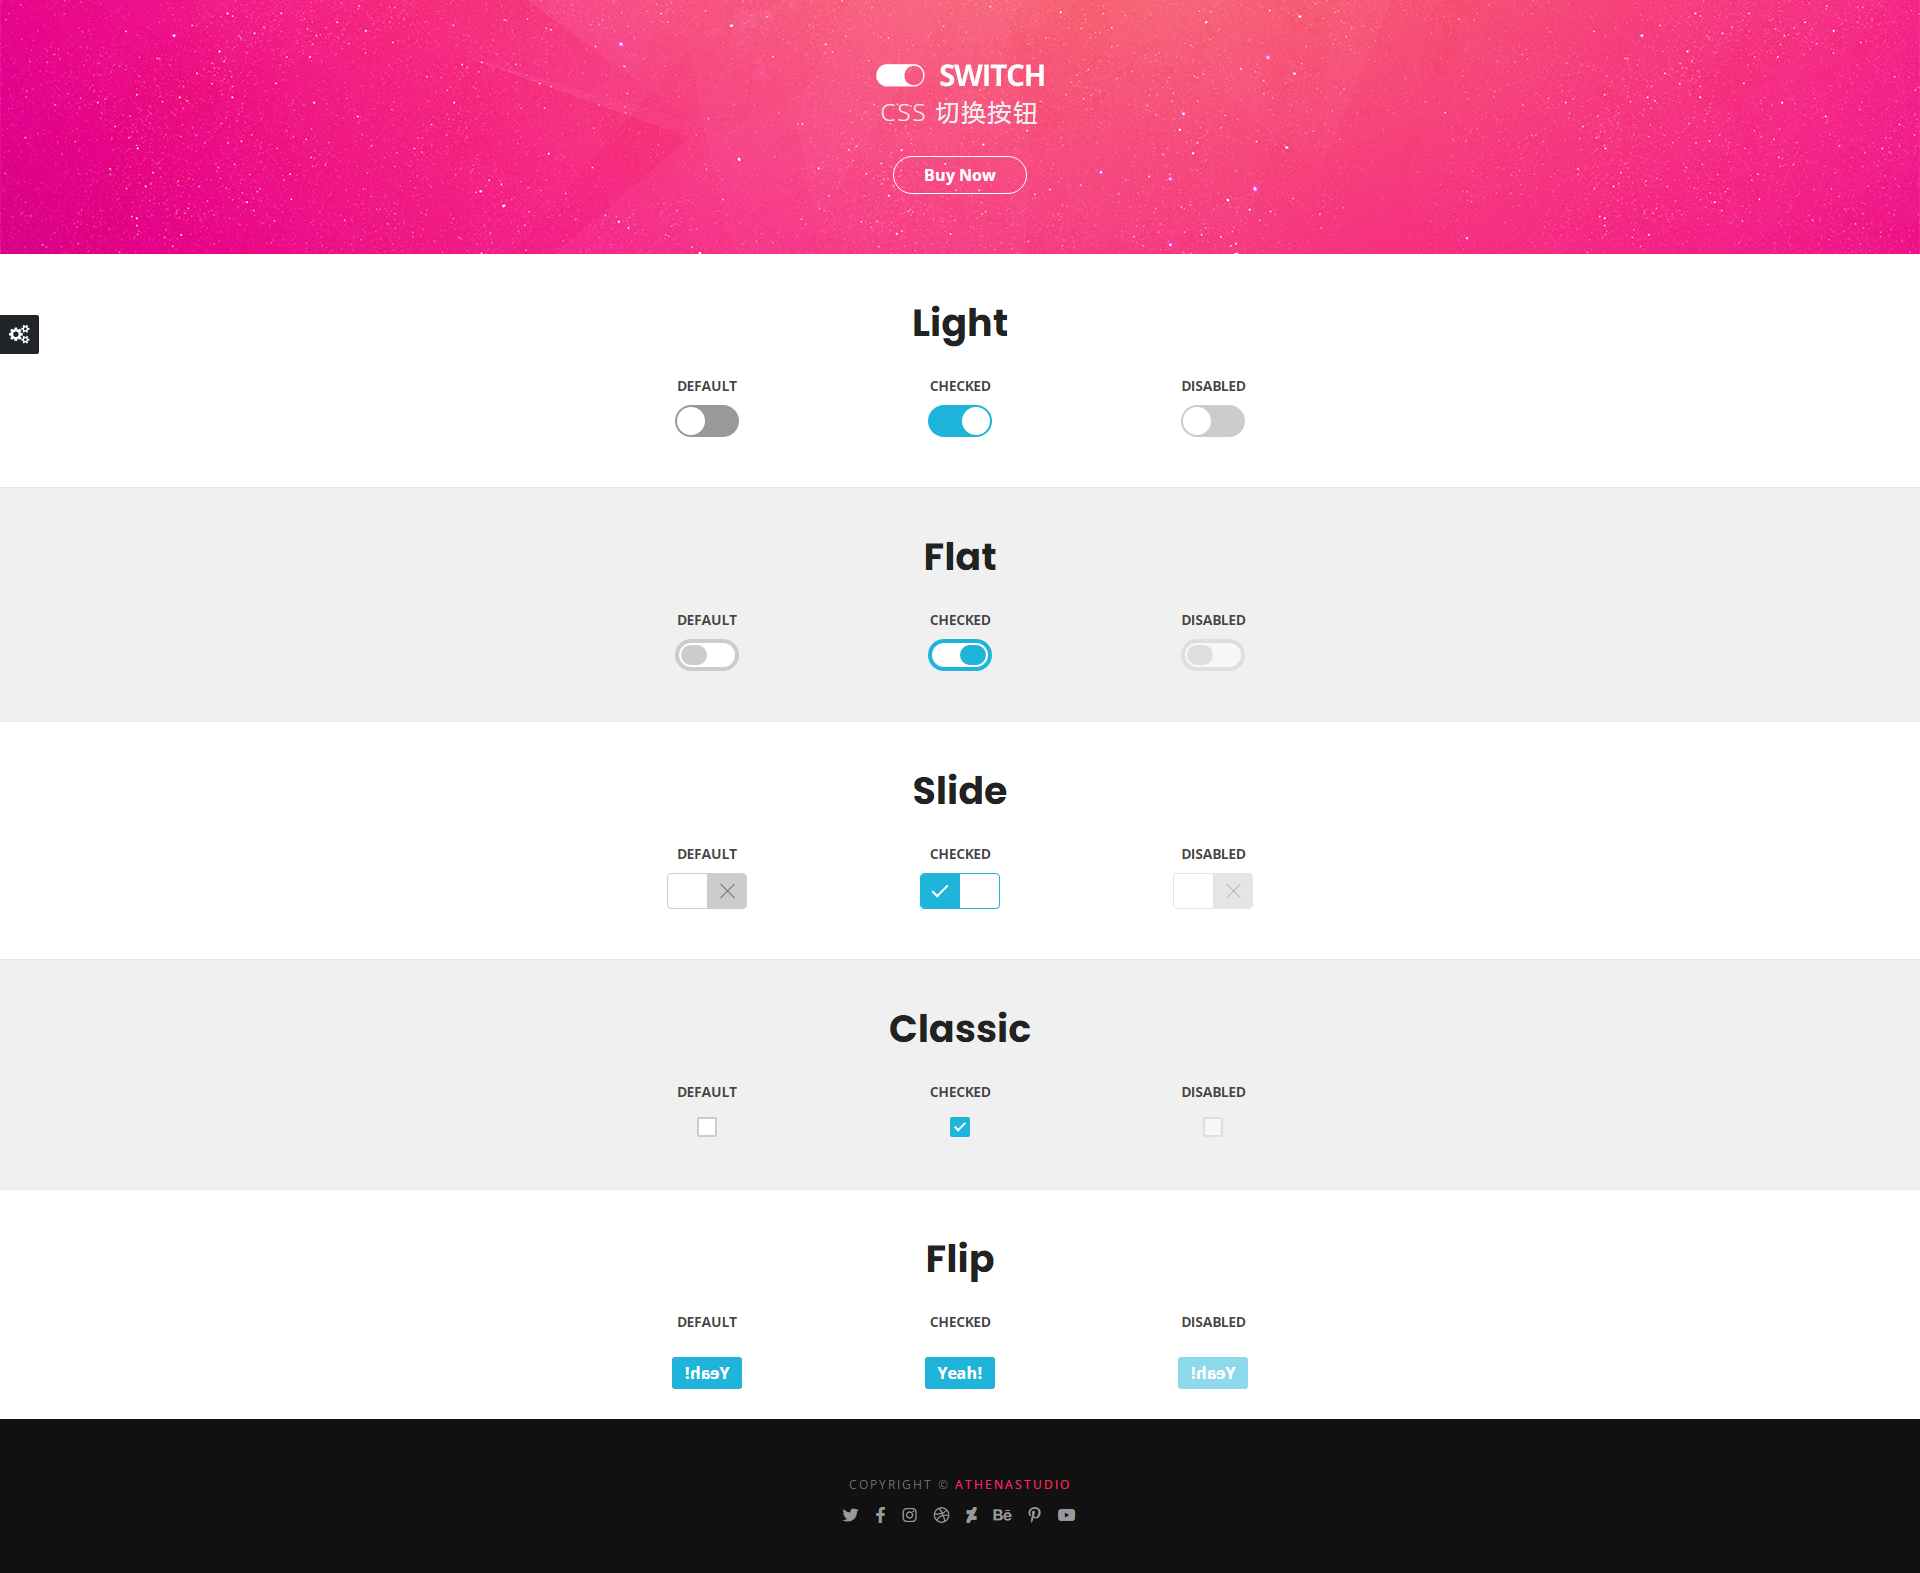
Multiple sets of creative CSS3 switch button codes
Pure css3 to create creative switch button switching.
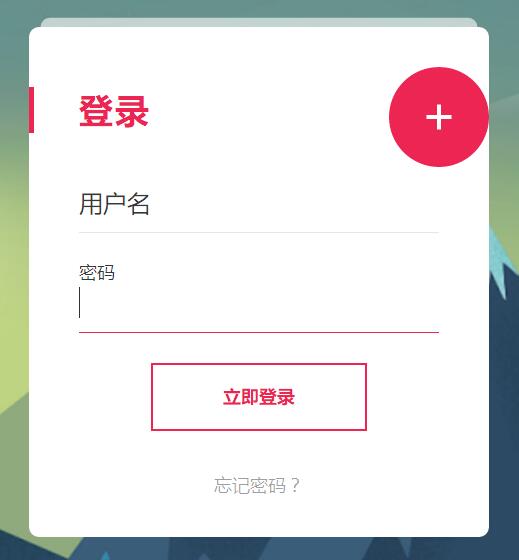
Registration login interface js special effects cool switching code
Registration login interface js special effects cool switching code.
5 classic switching button interaction effects
5 classic switching button interactive effect designs


