Rumah >hujung hadapan web >tutorial js >在angularjs中如何实现柱状图动态加载
在angularjs中如何实现柱状图动态加载
- 亚连asal
- 2018-06-21 14:40:211636semak imbas
本篇文章主要介绍了angularjs实现柱状图动态加载的示例,小编觉得挺不错的,现在分享给大家,也给大家做个参考。一起跟随小编过来看看吧
一 准备工作
1.引用文件
下面链接中有一个jquery.js文件,请在index.html中引用。
2.新建文件
新建一个js文件,编写指令。这也是我第一次写指令,指令可扩展性强,还很方便,当项目中重复使用的一些效果时可以通过指令来减少冗余的代码。
二 代码编写
/**
* Created by xiehan on 2017/12/8.
* 柱状图动态加载指令
*/
angular.module('studyApp.directives')
.directive('progressPer', function ($compile,$timeout) {
return {
restrict: 'AE',
scope: {
progressData: '='
},
template: ' <p class="progress-main" ng-repeat="item in progressData">'+
'<p class="progress-data">'+
'<span>{{item.name}}</span>'+
'<p class="skillbar clearfix " data-percent={{item.width}}>'+
'<p class="skillbar-bar"></p>'+
'<p class="skill-bar-percent">{{item.sum}}</p>'+
'</p>'+
'</p>'+
'<p class="progress-rate">{{item.percent}}</p>'+
'</p>',
replace: true,
transclude: true,
link: function (scope, element, attrs) {
$compile(element.contents())(scope.$new());
$timeout(function() {
jQuery('.skillbar').each(function(){
jQuery(this).find('.skillbar-bar').animate({
width:jQuery(this).attr('data-percent')
},1000);
});
});
}
}
});/**
* Created by xiehan on 2017/11/29.
* controller文件
*/
angular.module('studyApp.controllers')
.controller('ProgressCtrl', function ($scope, $rootScope, $ionicHistory,$timeout,$location) {
$scope.title = '进度条效果';
$scope.goBack = function () {
$ionicHistory.goBack();
};
var dataInfo=[
{
NAME:"测试1",
NUM:30,
RATE:30
},
{
NAME:"测试2",
NUM:25,
RATE:25
},
{
NAME:"测试3",
NUM:45,
RATE:45
}
];
handleTabData(dataInfo);
function handleTabData(data){
var widthData=[];
for(var i = 0;i<data.length;i++){
widthData.push({
width:data[i].RATE+'%', //进度条百分比
name:data[i].NAME, //标题
sum:data[i].NUM, //数量
percent:data[i].RATE+'%'}); //百分比
}
$scope.handleDataInfo = widthData;
//不使用指令加上下面的代码
// $timeout(function() {
// jQuery('.skillbar').each(function(){
// jQuery(this).find('.skillbar-bar').animate({
// width:jQuery(this).attr('data-percent')
// },1000);
// });
// });
}
});<ion-item>不使用指令</ion-item>
<p class="progress-main" ng-repeat="item in handleDataInfo">
<p class="progress-data">
<span>{{item.name}}</span>
<p class="skillbar clearfix " data-percent={{item.width}}>
<p class="skillbar-bar"></p>
<p class="skill-bar-percent">{{item.sum}}</p>
</p>
</p>
<p class="progress-rate">{{item.percent}}</p>
</p>
<ion-item>使用指令</ion-item>
<progress-per progress-data="handleDataInfo"></progress-per>/***************进度条样式css********/
.skillbar {
position: relative;
display: block;
margin-bottom: 15px;
width: 100%;
background: #eee; /**背景颜色**/
height: 35px;
border-radius: 3px;
-moz-border-radius: 3px;
-webkit-border-radius: 3px;
-webkit-transition: 0.4s linear;
-moz-transition: 0.4s linear;
-ms-transition: 0.4s linear;
-o-transition: 0.4s linear;
transition: 0.4s linear;
-webkit-transition-property: width, background-color;
-moz-transition-property: width, background-color;
-ms-transition-property: width, background-color;
-o-transition-property: width, background-color;
transition-property: width, background-color;
}
.skillbar-bar {
height: 35px;
width: 0px;
background: #50d2c2;
border-radius: 3px;
-moz-border-radius: 3px;
-webkit-border-radius: 3px;
}
.skill-bar-percent {
position: absolute;
right: 10px;
top: 0;
font-size: 11px;
height: 35px;
line-height: 35px;
color: #ffffff;
color: rgba(0, 0, 0, 0.4);
}
.progress-main{
display: flex;
display: -webkit-flex;
align-items: center;
-webkit-align-items: center;
justify-content: center;
-webkit-justify-content: center;
margin-top: 10px;
}
.progress-data{
margin-left: 5%;
width: 100%;
float: left;
}
.progress-rate{
float: right;
width: 20%;
line-height: 35px;
margin-left: 5%;
margin-top: 10px;
}三 效果图

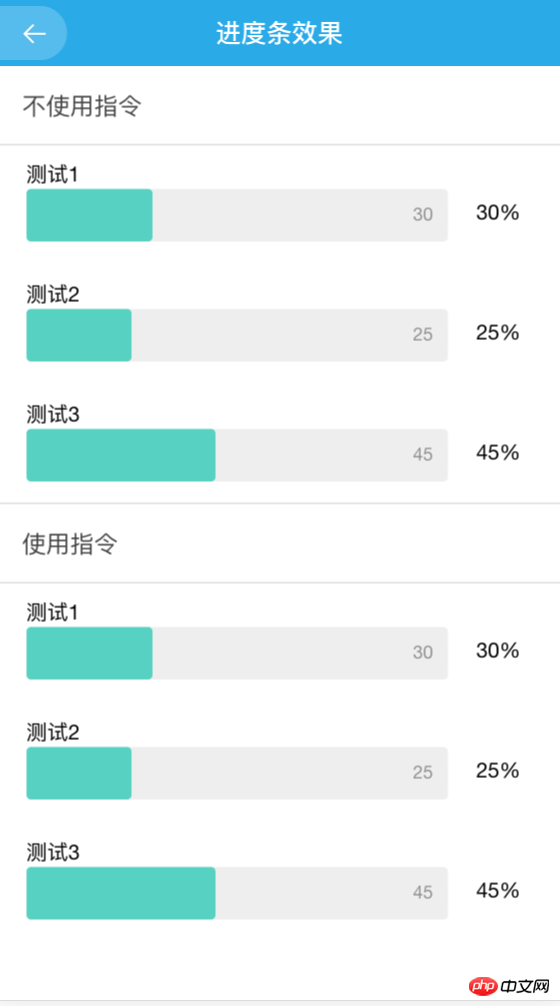
上面是我整理给大家的,希望今后会对大家有帮助。
相关文章:
Atas ialah kandungan terperinci 在angularjs中如何实现柱状图动态加载. Untuk maklumat lanjut, sila ikut artikel berkaitan lain di laman web China PHP!
Kenyataan:
Kandungan artikel ini disumbangkan secara sukarela oleh netizen, dan hak cipta adalah milik pengarang asal. Laman web ini tidak memikul tanggungjawab undang-undang yang sepadan. Jika anda menemui sebarang kandungan yang disyaki plagiarisme atau pelanggaran, sila hubungi admin@php.cn
Artikel sebelumnya:在Angular作用域中scope的如何使用Artikel seterusnya:在Vue中有关响应式原理(详细教程)
Artikel berkaitan
Lihat lagi- Analisis mendalam bagi komponen kumpulan senarai Bootstrap
- Penjelasan terperinci tentang fungsi JavaScript kari
- Contoh lengkap penjanaan kata laluan JS dan pengesanan kekuatan (dengan muat turun kod sumber demo)
- Angularjs menyepadukan UI WeChat (weui)
- Cara cepat bertukar antara Cina Tradisional dan Cina Ringkas dengan JavaScript dan helah untuk tapak web menyokong pertukaran antara kemahiran_javascript Cina Ringkas dan Tradisional

